
Fig. 3.
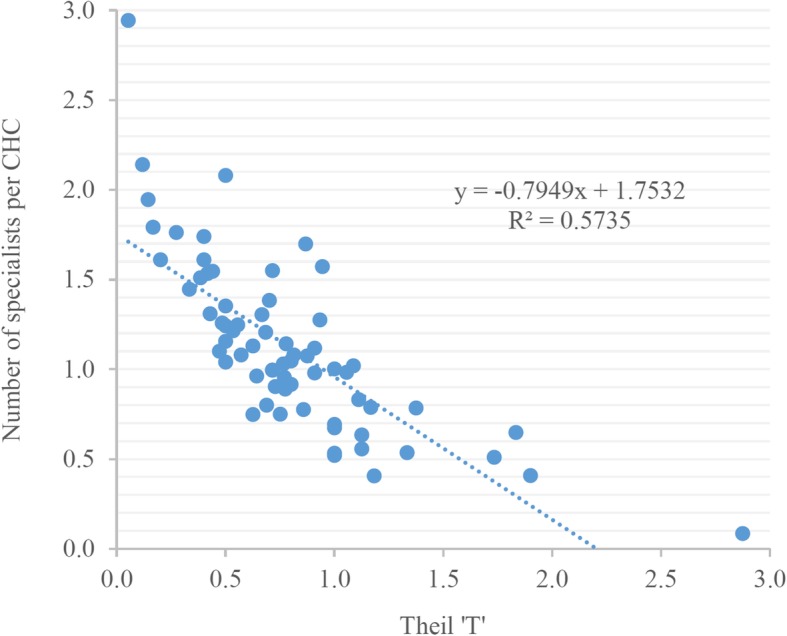
The relationship between the average availability of specialists and the level of inequality in their distribution across 70 districts of Uttar Pradesh, 2012–13
Official websites use .gov
A
.gov website belongs to an official
government organization in the United States.
Secure .gov websites use HTTPS
A lock (
) or https:// means you've safely
connected to the .gov website. Share sensitive
information only on official, secure websites.
The relationship between the average availability of specialists and the level of inequality in their distribution across 70 districts of Uttar Pradesh, 2012–13