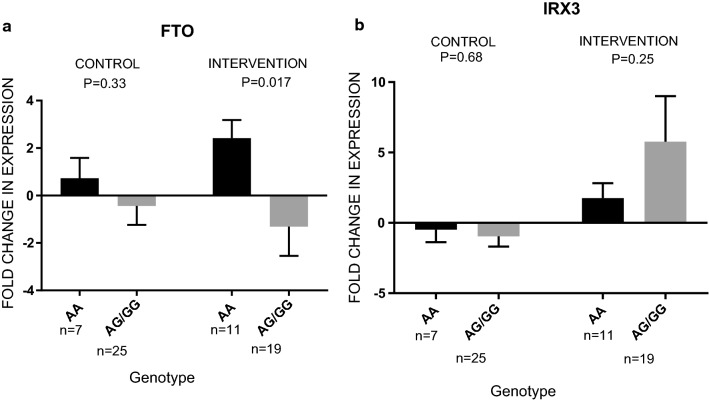
Fig. 3.
The role of FTO genotype on IRX3 and FTO expression. Gray is used for the graphs of the subjects with AG/GG genotype of rs9930506 and black is used for the graphs of the subjects with AA genotype. FTO expression was up-regulated in AA carriers and down-regulated in G allele carriers in the intervention group

