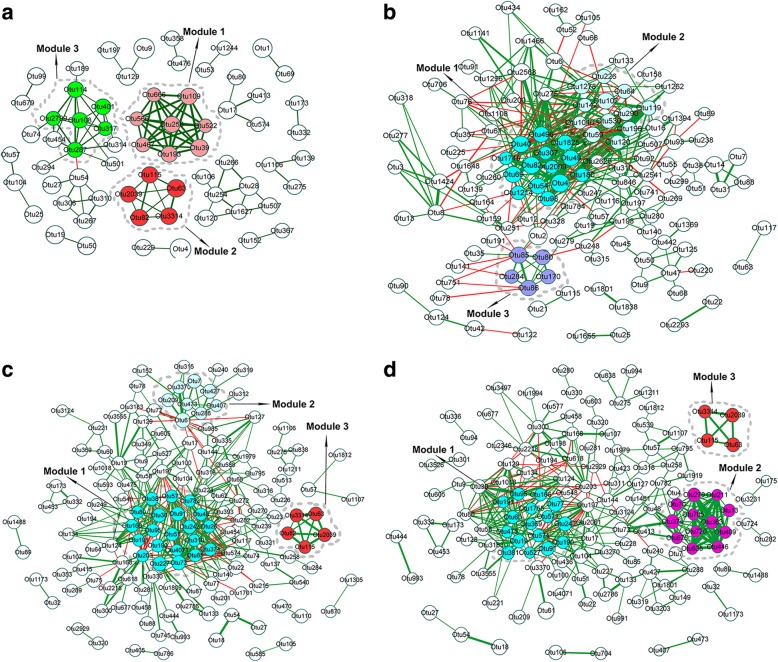
Fig. 4.
The phylogenetic co-occurrence networks of porcine fecal microbiota at four ages. The networks were constructed at the OTU level. (a) 25 days. (b) 80 days. (c) 120 days. (d) 240 days. The size of the nodes shows the abundance of OTUs, and the different colors indicate the modules within networks. The same color shows the similar modules. Edge color represents positive (green) and negative (red) correlations. The edge thickness indicates the correlation values, only the high-confidence interactions with absolute sparse correlations more than 0.55 were selected

