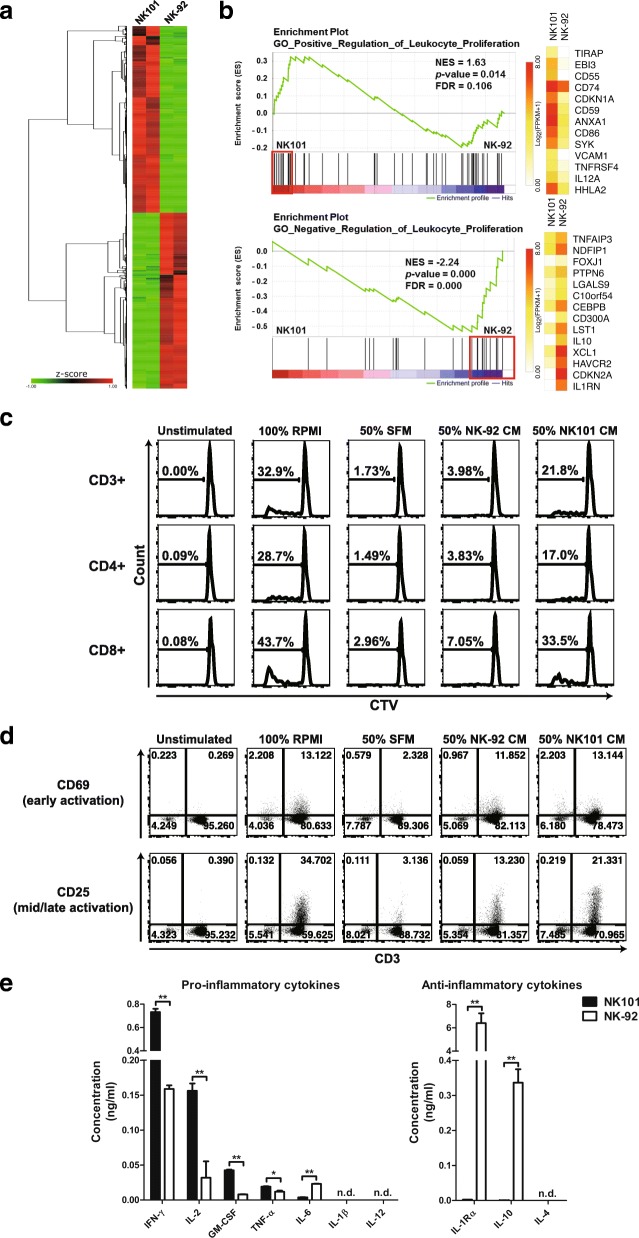
Fig. 5.
Comparative analysis of molecular expression profiles and immunostimulatory potential between NK101 and NK-92. a A heat map displaying upregulated (red) and downregulated (green) genes is shown (q < 0.05). Genes were clustered by one minus Pearson correlation with complete linkage algorithm. Signal levels are shown as z-score color key. b Gene set enrichment analysis (GSEA) was performed in terms of ‘positive regulation of leukocyte proliferation’ (top) or ‘negative regulation of leukocyte proliferation’ (bottom), then the enrichment plots were illustrated with normalized enrichment score (NES), p-value, and false discovery rate (FDR). Core genes for each term were marked by red boxes, and their expression levels were exhibited as heatmaps. A white-yellow-red color scale indicates expression level of each gene transformed as Log2 (FPKM+ 1). c, d Human PBMCs labeled with CellTrace Violet (CTV) were either unstimulated or stimulated with anti-CD3 and cultured under indicated conditions for 5 days. Total cells were stained using Live/Dead Fixable Viability Dye and fluorochrome-conjugated antibodies specific to either CD3/CD4/CD8 (c) or CD3/CD25/CD69 (d). c Representative histograms for CTV in the gate of CD3+, CD4+, and CD8+ cells are shown. d Representative dot plots for CD69 and CD25 expression are exhibited in terms of CD3+ population after live cell gating. The results are representative of 2 independent experiments from a single donor in triplicate. SFM, serum-free medium; CM, conditioned medium. e The concentrations of indicated pro- and anti-inflammatory cytokines in CM derived from NK101 (black bars) or NK-92 (white bars) were measured by an individual ELISA kit. Data represent mean ± SD of triplicate wells from 2 independent experiments. *p < 0.05, **p < 0.01; n.d., not detected

