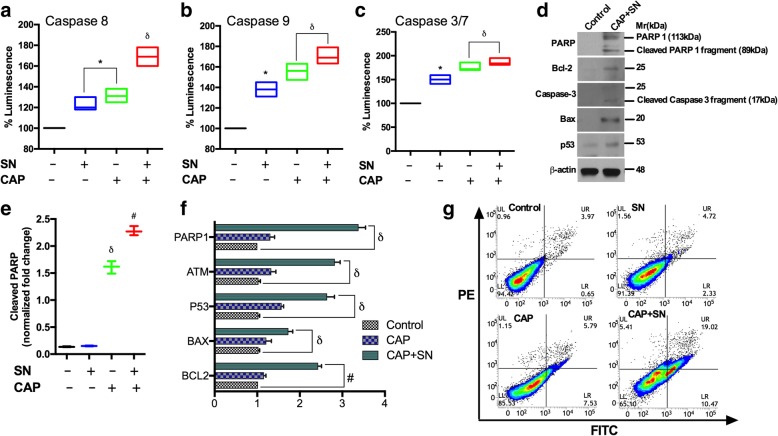
Fig. 4.
Co-inhibition by SN (100 nM) and CAP (180 s) in G-361 cellular death induction by different mechanisms. (a) Caspase 8, (b) caspase 9 and (c) caspase 3/7 levels by using spectrophotometrically (d) Immunoblot showing the detection of PARP/cleaved PARP, Bcl-2, caspase cleavage, Bax and the p53 activation status (e) Cleaved PARP estimation in different groups using spectrophotometrically. (f) The m-RNA expression levels of PARP-1, ATM, p53, BAX, and Bcl-2 were estimated using RT-PCR (g) Apoptotic cell death (annexin V/PI staining) was measured using flow cytometry. Error bars indicate the ±SD (n = 3). Student’s t-tests were performed, and the levels of significance are indicated as follows: *, p < 0.05; δ, p < 0.01; and #, p < 0.001

