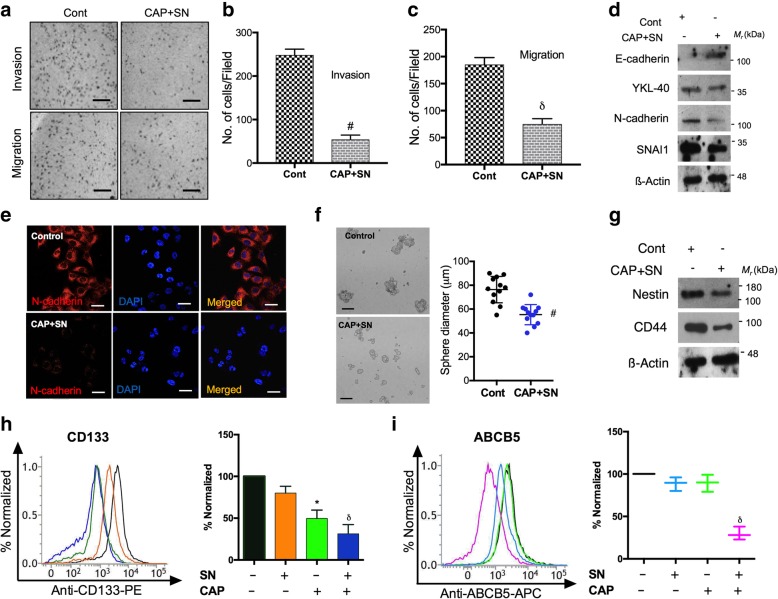
Fig. 6.
Bifold effect of SN (100 nM) and CAP (180 s) on the regulation of EMT and cancer stem cells in G-361 cells. (a) Migration and invasion assays were conducted after a co-treatment with 100 μM of SN and 180 s of CAP in G-361 cells. The scale bar corresponds to 30 mm. Graphical representation of G-361 cells that (b) invaded and (c) migrated under similar treatment conditions. (d) Western blot analysis of the EMT markers of E-cadherin, YKL-40, N-cadherin, and SNA/1 in G-361 cells (e) Immunocytochemistry of the mesenchymal marker N-cadherin in co-treated with G-361 cells and counterstained with DAPI. The scale bar corresponds to 10 mm. (f) Quantification of the sphere-forming ability of G-361 cells. The scale bar corresponds to 20 mm. (g) Western blot analysis of nestin and CD44 for the reduction in cancer stem cell markers (h) Flow cytometric analysis and graphical representation of CD133 expression levels after a co-treatment with SN and CAP using flow cytometry (i) Melanoma precise ABCB5 expression recorded in a flow cytometry analysis and its graphical representation using conditions identical to those above. Student’s t-tests were performed, and the levels of significance are indicated as follows: *, p < 0.05; δ, p < 0.01; and #, p < 0.001

