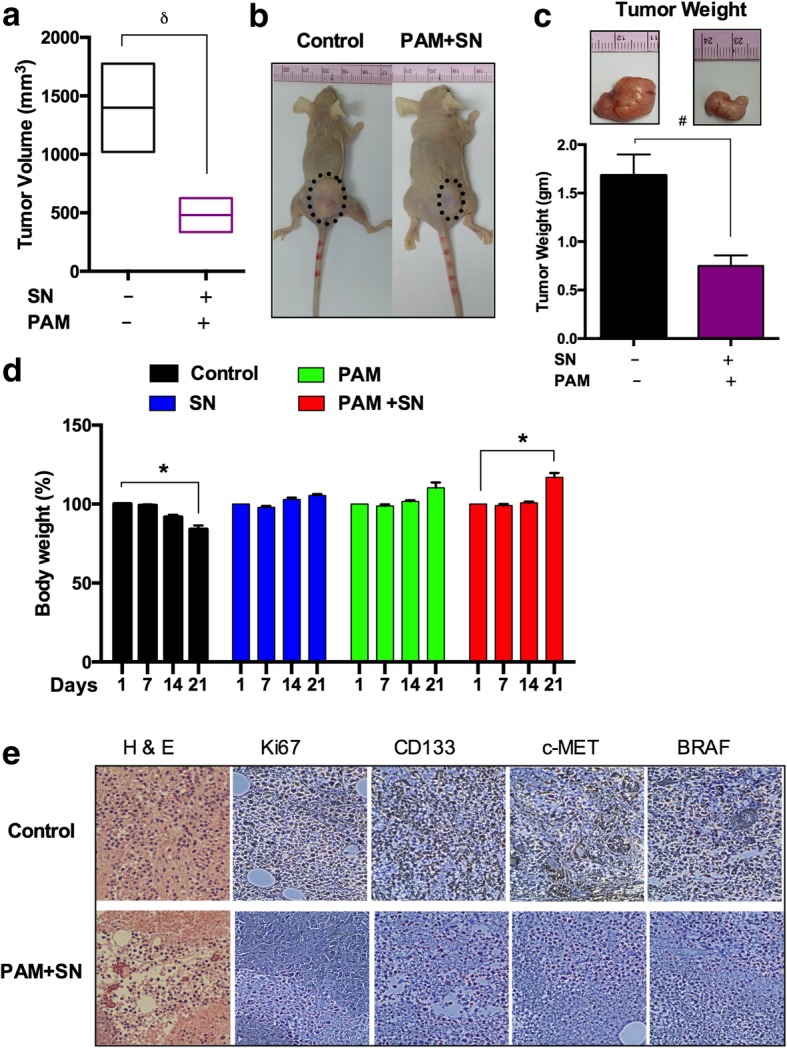
Fig. 7.

Anti-tumor effect of SN and PAM treatment in mice model. (a) Changes of the tumor volume in xenograft mice models. (b) Macroscopic observation of a control group and CAP-activated media and SN treated nude mice group bearing subcutaneous tumors on the right hind flank. (c) The bar graph shows the mean tumor weight of the excised control and treated melanomas. Photographs of solid melanomas removed from control and treatment groups at the time of the termination of this study are shown above the respective bar graphs. (d) Graphical representation of body weights (%) of the control and treated nude mice groups from 1 day to 21 days. (e) Representative hematoxylin and eosin (H & E) staining of tissue sections of both groups (magnification, 40X). Immunohistochemical analysis of Ki67, CD133, C-MET and BRAF expression levels in treated and untreated tumors tissues. The scale bar corresponds to 100 mm. Student’s t-tests were performed, and the levels of significance are indicated as follows: *, p < 0.05; δ, p < 0.01; and #, p < 0.001
