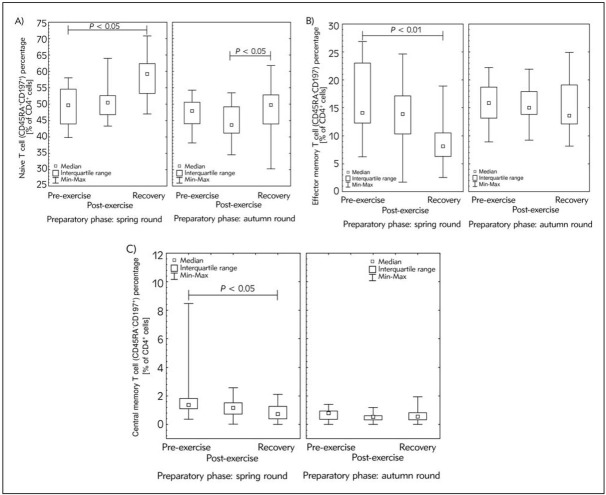
Figure 2.
Median of the percentage of CD4+ memory T cell subsets: A) T Naïve cells (CD45RA+CD197+), B) T effector memory cells (TEM; CD45RA-CD197-) and C) T central memory cells (TCM; CD45RA-CD197+) of studied participants’ blood samples during the experiment at the beginning of preparatory phase to spring and autumn competition round, respectively. CD4+ memory T cell subsets analysis protocol was performed using commercial antibodies assay kit (Human Naïve/Memory T Cell Panel) according to the manufacturer instructions and analysed using BD Accuri™ C6 flow cytometer. The midpoint represents median; box represents inter quartile range; whiskers represent min-max range. Significance level of differences observed between spring and autumn experiment was calculated using Wilcoxon’s matched-pairs test. Significance level of differences observed between analysed time points (pre-exercise vs. post-exercise vs. recovery) was assessed using Friedman’s analysis of variance followed by post-hoc Dunn’s test with Bonferroni correction.

