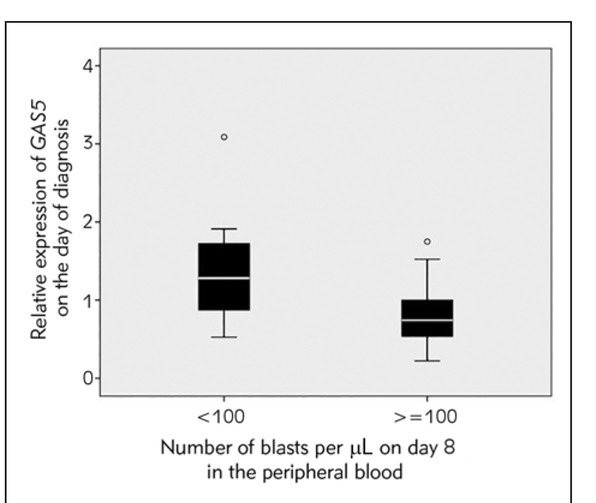
Figure 2.

Boxplot chart showing relative expression level of GAS5 in patients’ mononuclear cells on the day of diagnosis in patients with an absolute number of blasts per μL of peripheral blood on day 8 below 100 and no less than 100 (Mann-Whitney test, p=0.016).
