
Figure 4.
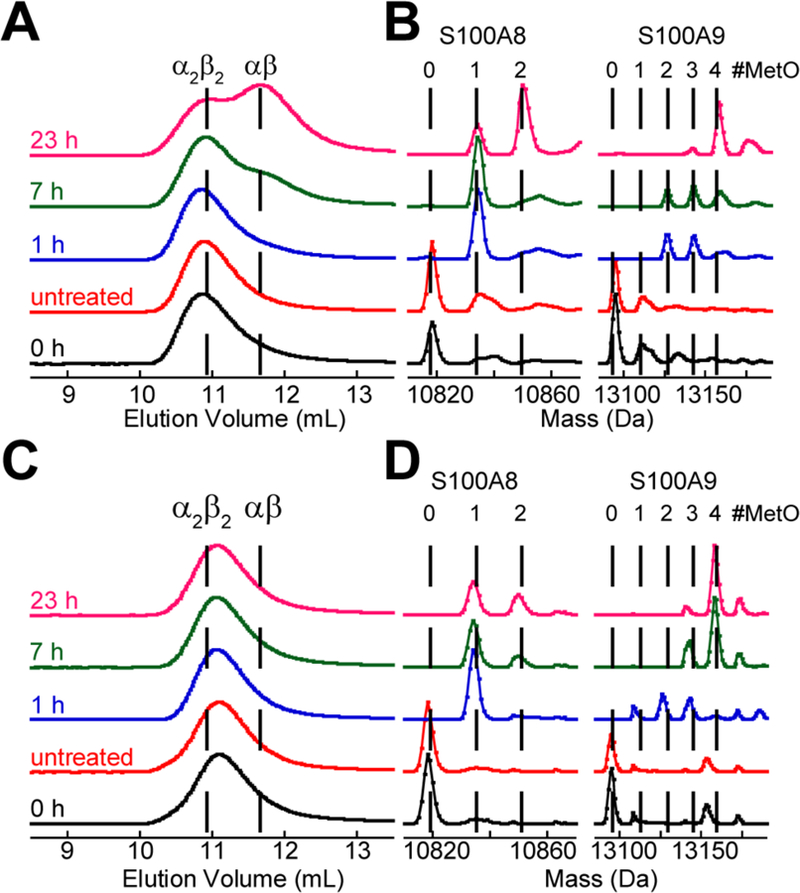
SEC chromatograms and corresponding deconvoluted mass spectra of 30 µM CP-Ser treated with 100 mM H2O2 in the presence of 1.5 mM Ca(II) or both 1.5 mM Ca(II) and 30 µM Mn(II) (75 mM HEPES, 100 mM NaCl, pH 7.5). In the mass spectra, the dashed lines represent the expected masses of the CP subunits with additional oxygen atoms. The chromatograms and mass spectra were normalized to a maximum value of 1. The listed times correspond to the duration of treatment with H2O2 prior to sample analysis. The untreated sample was incubated at 37 °C for 23 h. (A) SEC chromatograms for the Ca(II) only samples. (B) Regions of the deconvoluted mass spectra showing the S100A8 and S100A9 subunits for the Ca(II) only samples. (C) +Ca(II)+Mn(II) SEC. (C) SEC chromatograms for the Ca(II) and Mn(II) samples. (D) Regions of the deconvoluted mass spectra showing the S100A8 and S100A9 subunits for the Ca(II) and Mn(II) samples. In the SEC chromatograms, the Mn(II)- and Ca(II)-bound CP-Ser tetramer elutes slightly later than the Ca(II)-bound CP-Ser tetramer.