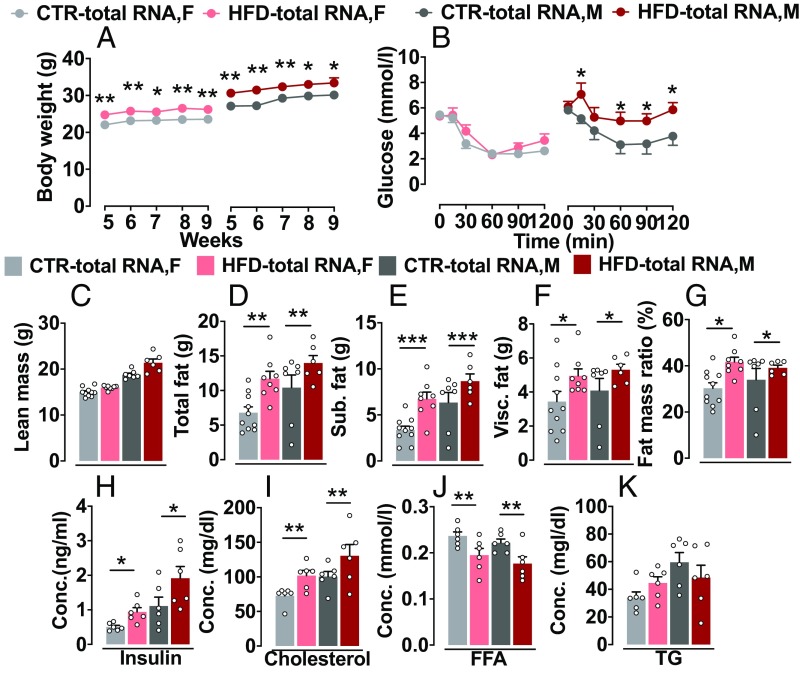
Fig. 2.
Altered metabolic phenotypes in HFD-total RNA–injected offspring. (A) Body weight: HFD-total RNA offspring showed gradually increased body weight compared with the CTR-total RNA offspring. CTR-total RNA, n = 19 (8 M, 11 F); HFD-total RNA, n = 18 (8 M, 10 F). (B) Insulin tolerance test: HFD-total RNA offspring had higher blood glucose level than CTR-total RNA following an insulin injection. HFD-total RNA male offspring showed a stronger impairment of insulin sensitivity. CTR-total RNA, n = 19 (8 M, 11 F); HFD-total RNA, n = 16 (8 M, 8 F). (C–G) Distribution of fat: HFD-total RNA offspring displayed a marked increase in total fat, s.c. fat, visceral fat, and fat mass ratio, with no difference in lean mass. CTR-total RNA, n = 17 (7 M, 10 F); HFD-total RNA, n = 14 (6 M, 8 F). (H–K) Plasma parameters: HFD-total RNA group showed higher fasted plasma insulin and cholesterol and lower FFA levels but no difference in plasma triglyceride (TG) levels compared with CTR (n = 6 M/6 F per group). Data are presented as mean ± SEM (*P < 0.05, **P < 0.01, and ***P < 0.001). F, female; M, male.

