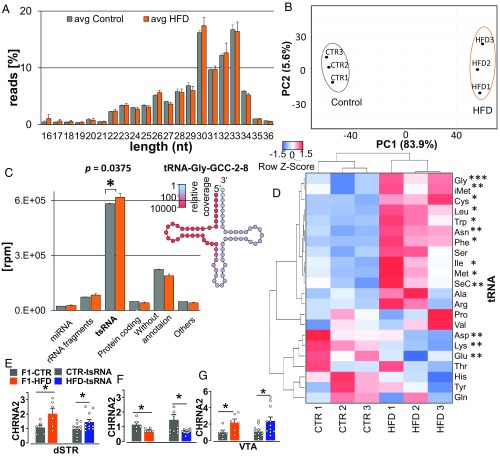
Fig. 8.
Sperm sncRNA profile in F1 fathers and differences in transcriptomes in brain of F1 father and tsRNA offspring. (A) Length distribution of sncRNA sequence reads from F1-HFD and F1-CTR males. Error bars indicate SD. (B) Principal component analysis based on 4,822 differentially expressed sncRNA species. x and y axes show principal components 1 (PC1) and 2 (PC2) that explain 83.9% and 5.6% of the total variance, respectively. (C) Composition of sncRNA transcriptomes. tsRNAs constitute the majority of sncRNAs in HFD and CTR groups. (Inset) Example of relative sncRNA coverage of tRNA-Gly-GCC-2–8. Error bars indicate SD. (D) Heat map displays relative expression of tsRNAs derived from different tRNAs across HFD and control probes. Thirteen tRNA fragments showed a significant difference in expression. Clustering bases on average linkage. The Pearson distance measurement method was used. (E) The increased level of CHRNA2 in the dSTR of F1 HFD and HFD-tsRNA offspring compared with CTR littermates. (F) Decreased levels of CHRNA2 in the Nac of F1-HFD and HFD-tsRNA offspring compared with their CTR littermates. (G) Higher expression of CHRNA2 in the VTA of F1-HFD male and HFD-tsRNA offspring compared with CTR. F1-CTR, n = 6; F1-HFD, n = 6; CTR-tsRNA, n = 12; HFD-tsRNA, n = 12. Data are presented as mean ± SEM (*P < 0.05).

