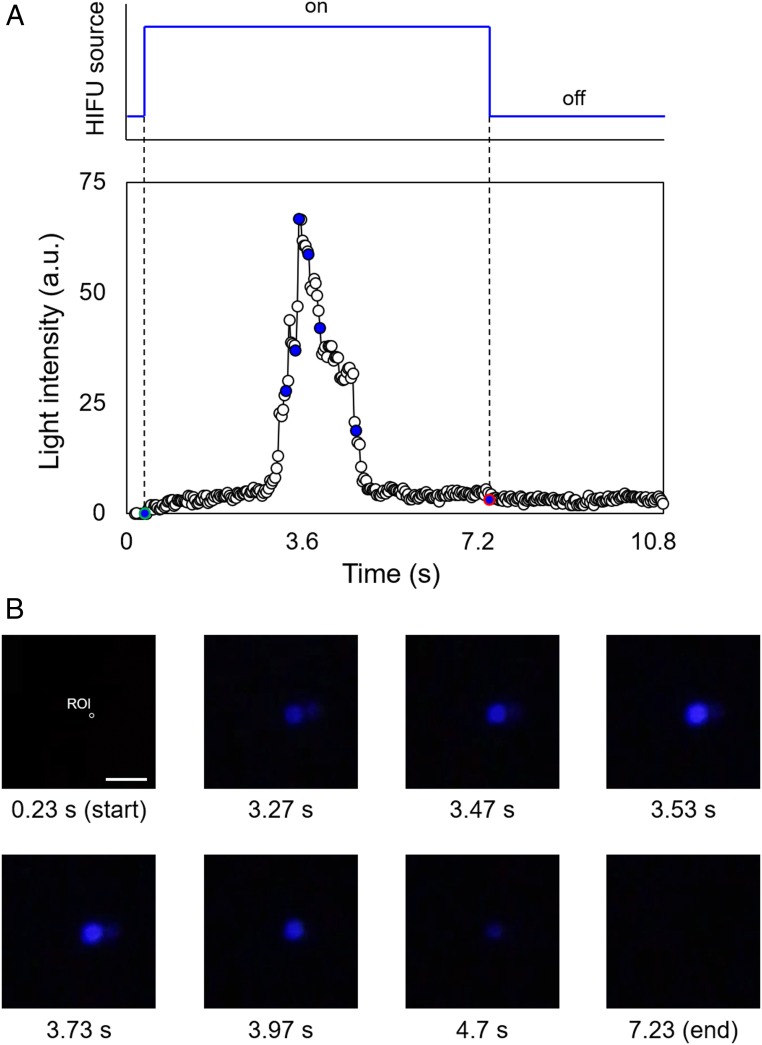
Fig. 5.
Mechanoluminescent behavior of dioxetane-functionalized PDMS: (A) Plot of the generated blue-light intensity versus time (a.u., arbitrary units); and (B) optical images showing the intensity versus HIFU irradiation time. The intensity plot is based on light generated in the focal spot (∼2.25 mm, 550 kHz). Green- and red-colored points in the plot indicate the start and end points of sonication, respectively. (Scale bar: 5.0 mm.)

