Fig. 3.
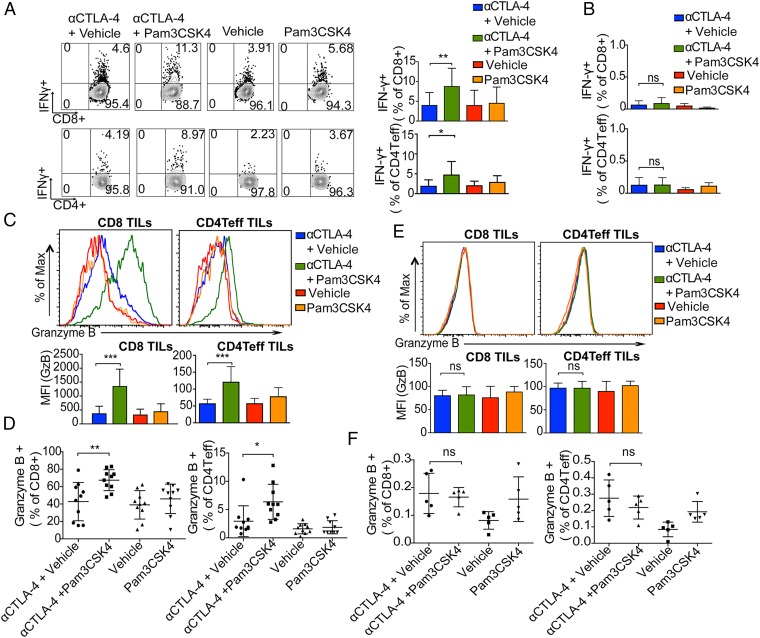
Enhanced proinflammatory cytokine production and granzyme B expression in TILs by combination of Pam3CSK4 and CTLA-4 blockade. Mice were challenged with B16/F10 cells and given indicated treatments; tumors and dLNs cells were harvested, activated ex vivo with B16/F10 antigen-loaded DCs, and stained with indicated antibodies as described in Materials and Methods. (A) Representative flow cytometry plots and bar graphs of IFN-γ in CD8 T cells and CD4 Teff cells from TILs. Bar graphs show the cumulative frequencies of IFN-γ producers among tumor-infiltrating CD8 T cells and CD4 Teff from two of three independent experiments with five mice per group. (B) Bar graphs show the cumulative frequencies of IFN-γ producers among CD8 T cells and CD4 Teff in draining lymph nodes from two of three independent experiments with five mice per group. (C) Representative histogram plots (Top) and mean fluorescence intensity (MFI) plots (Bottom) of granzyme B staining of tumor-infiltrating CD8 T cells and CD4 Teffs. Data are representative of three or four experiments with five mice per group. (D) Cumulative frequencies of granzyme B+ CD8 T cells and granzyme B+ CD4 Teffs from two of three or four independent experiments with five mice per group. (E) Representative histogram plots (Top) and mean fluorescence intensity plot (Bottom) of granzyme B staining of draining lymph nodes’ CD8 T cells and CD4 Teffs. Data are representative of three or four experiments with five mice per group. (F) Frequencies of granzyme B+ CD8 T cells and CD4 Teffs among CD8 T cells and CD4 Teffs in draining lymph nodes. Data are representative of three or four experiments with five mice per group. Error bars represent the mean ± SD; ns, not significant; *P < 0.05, **P < 0.01, and ***P < 0.001 (Student’s t test).

