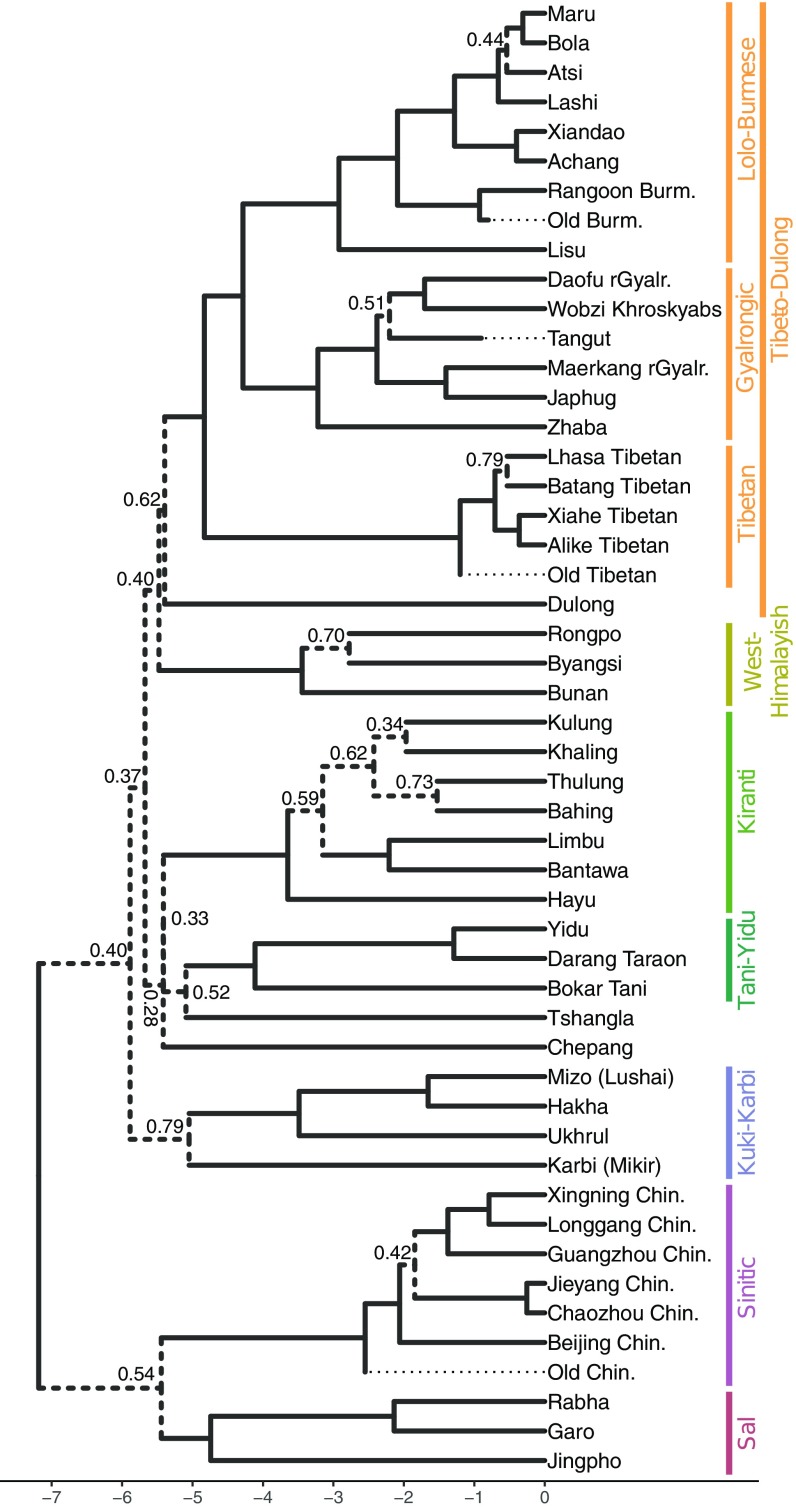
Fig. 2.
The Maximum Clade Credibility tree from the best-fitting model (relaxed clock with covarion). Branches with less than 0.8 posterior probability are dashed; other branches have posterior probabilities >0.8. For densitrees of the data, see SI Appendix, section 4.

