Fig. 3.
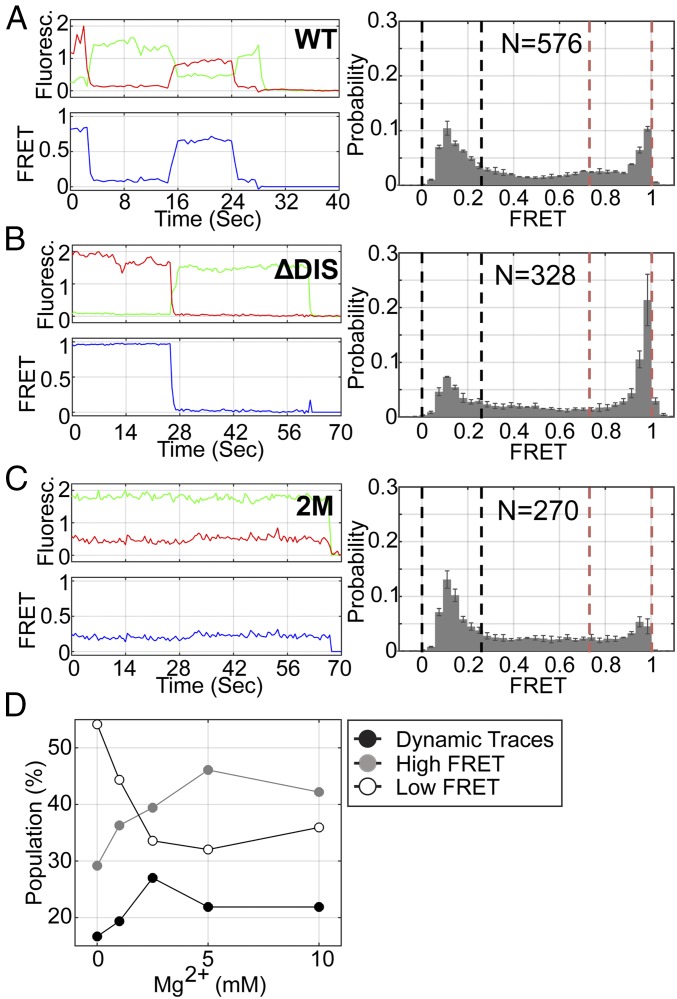
The 5′UTR transitions between monomeric and dimerization-competent conformations. (A) (Left) Fluorescence (green, donor; red, acceptor) and FRET (blue) trajectories acquired from an individual FH238.WT molecule. (Right) Population FRET histogram indicating that FH238.WT occupies a mixture of high- and low-FRET states. Black and red dashed lines indicate the upper and lower bound of low- and high-FRET SD, respectively. The number of FRET trajectories compiled into the histogram is indicated (N). The same data for the (B) FH238.ΔDIS and (C) FH238.2M constructs. (D) Fraction of the population of FH238.WT molecules displaying stable high-FRET (gray), stable low-FRET (open), and dynamic (black) traces as a function of MgCl2 concentration.

