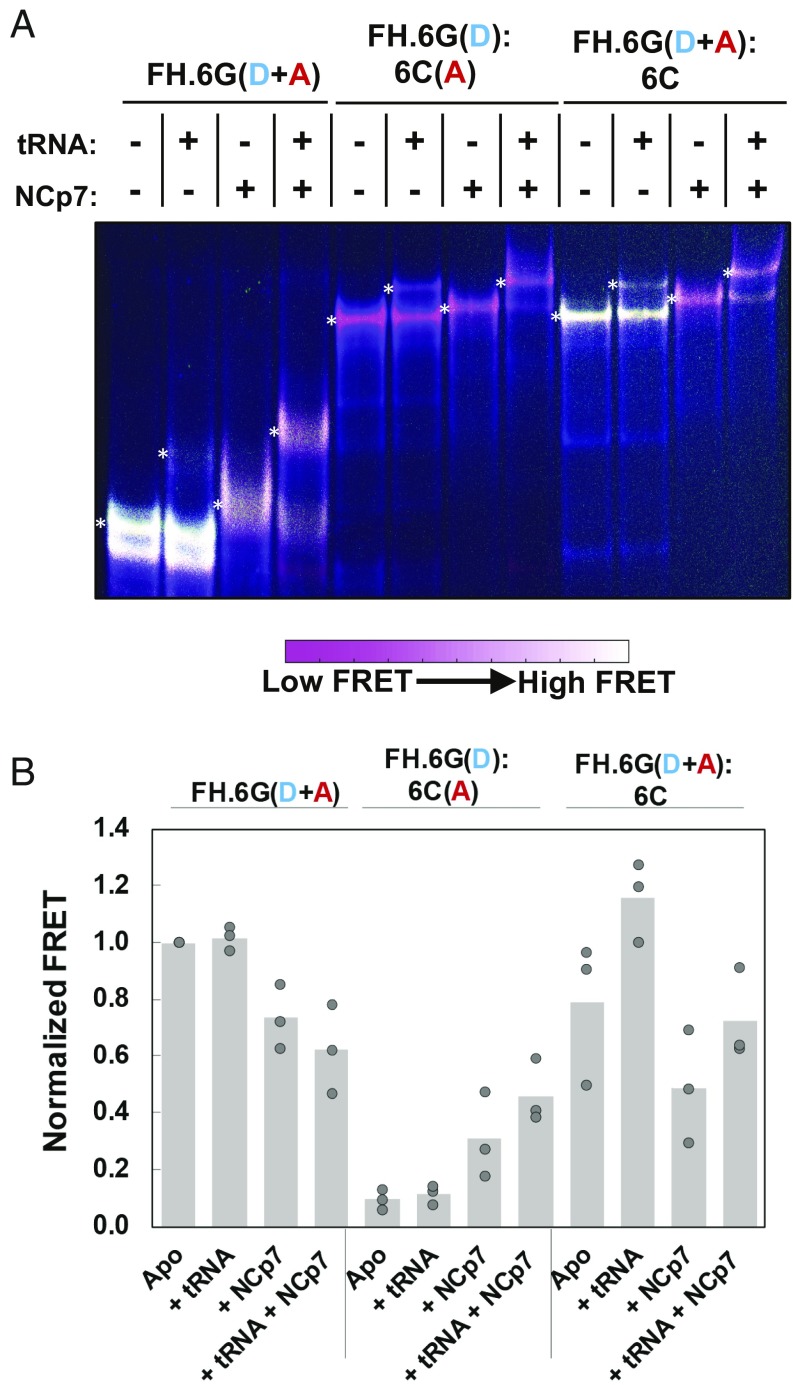
Fig. 6.
In-gel FRET assay and effect of NCp7-mediated tRNALys,3 annealing. (A) Native 6% polyacrylamide gel electrophoresis of FH238.6G (FH.6G) and 238.6C (6C) HIV-1 5′UTR constructs. The complexes were either labeled according to Inter-UTR FRET (lanes 1–4 and 9–12) or Intra-UTR FRET (lanes 5–8). The gel was run in the presence of 1 mM Mg2+ in the running buffer and gel matrix. The presence (+) or absence (−) of both tRNALys,3 and NCp7 is shown above each lane. The locations of the monomer (M), tRNALys,3-bound monomer (M + tRNA), dimer (D), and tRNALys,3-bound dimer (D + tRNA) bands are indicated. The color bar indicates how the range of colors corresponds qualitatively to in-gel FRET efficiency. (B) Quantification of in-gel FRET shown in A, with the slowest migrating band quantified for each lane (indicated by a white asterisk to the left of the quantified band). The FRET signal is normalized to high-FRET monomeric FH238.6G in lane 1. In each case, data from the three trials are shown with the mean value indicated by the height of the bar.

