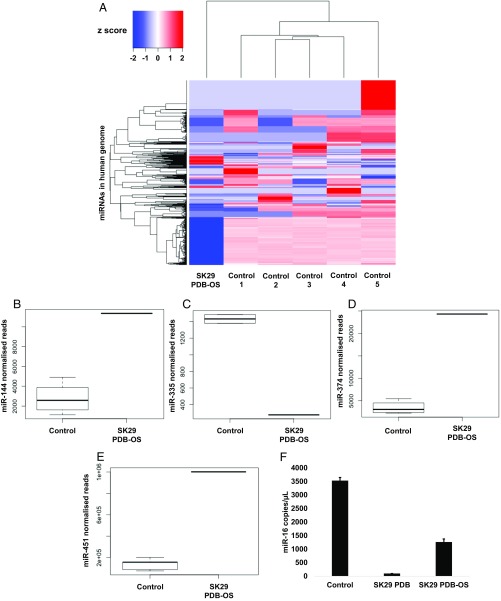
Fig. 4.
Ancient miRNA analysis in SK29, which harbors an osteosarcoma in the pelvis. (A) Hierarchical cluster analysis of differentially expressed miRNAs (y axis) between contemporary controls and SK29 PDB-OS (x-axis). Z-score refers to high (red) and low (blue) miRNA expression using normalized values compared with the mean of total sequencing reads. (B) Box plot of controls vs. SK29 PDB-OS shows that miR-144 is highly expressed in SK29 PDB-OS. (C) Box plot of controls vs. SK29 PDB-OS shows that miR-335 is down-regulated in SK29 PDB-OS. (D) Box plot of controls vs. SK29 PDB-OS shows that miR-374 is highly expressed in SK29 PDB-OS. (E) Box plot of controls vs. SK29 PDB-OS shows that miR-451 is highly expressed in SK29 PDB-OS. (F) Digital PCR for miR-16 expression performed with pooled cDNA obtained from contemporary controls, cDNA obtained from a PDB lesion in SK29, and cDNA obtained from PDB-OS in SK29. Data are reported as copies per microliter as calculated by Poisson distribution. Error bars represent SD. Consistent with previous data, miR-16 is highly expressed in PDB-OS compared with nontransformed PDB.

