Fig. 1.
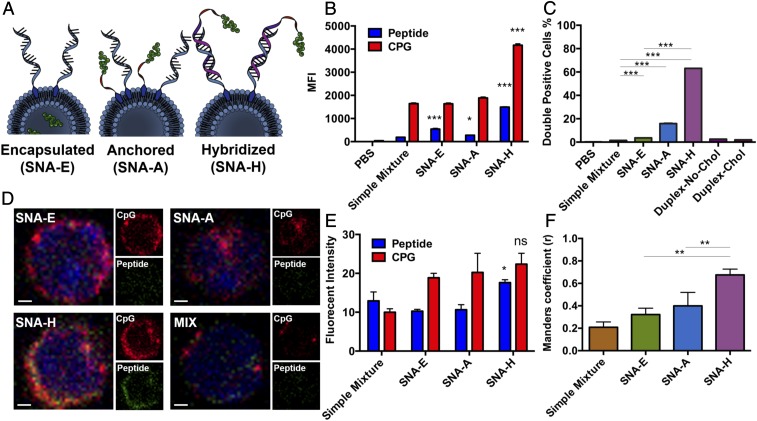
Evaluation of the dependence of CpG and antigen codelivery on SNA structure. (A) Scheme of three designs of SNA E, SNA A, and SNA H. (B) Uptake of CpG (Cy5) and OVA1 (TMR) by BMDCs in vitro, measured by flow cytometry. MFI, medium fluorescence intensity. (C) Fraction of cells showing high levels of both CpG and OVA1, recovered from the DLNs of mice (n = 3) 2 h following s.c. injection with reagents as indicated, as determined by flow cytometry. Values are an average of three replicates. Chol, cholesterol. (D) Images of cells recovered from DLNs from mice 4 h following immunization by s.c. injection, visualized by confocal microscopy. OVA1 peptide labeled with TMR is shown in green, and CpG labeled with Cy5 is shown in red. (Scale bars, 1 μm.) (E) Fluorescence intensity for OVA1 peptide and CpG of the images. (F) Subcellular colocalization of peptide and CpG was quantified by Manders coefficient (values of r > 0.6 indicate strong colocalization). Data presented as mean ± SEM (B, C, E, and F). ***P < 0.001; **P < 0.01; *P < 0.05. ns, not significant.

