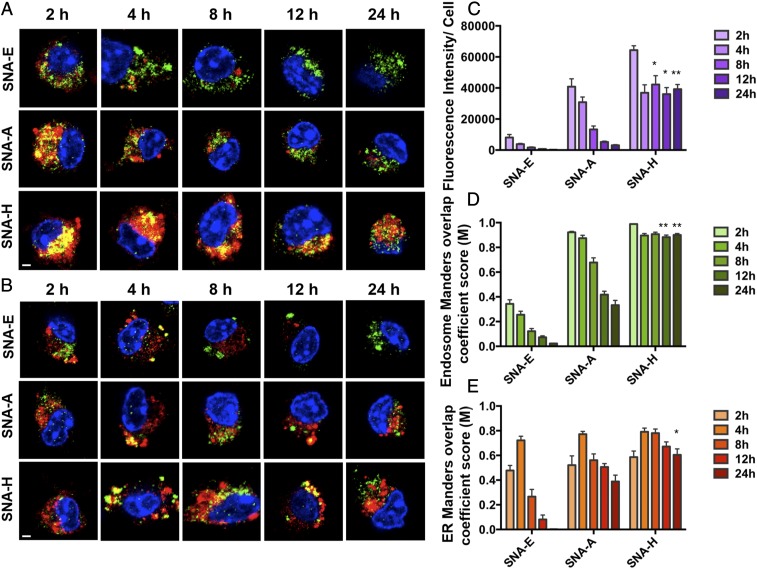
Fig. 2.
Evaluation of the time-dependent intracellular fate of antigens delivered by the three SNA structures by confocal microscopy. Images of OVA1 peptide (Cy5, red) colocalized with the LE (A; Alexa-568, green, Rab9) or ER (B; Alexa-568, green, PDI) delivered by SNA E, SNA A, and SNA H are shown. (Scale bars, 2 μm.) (C) Peptide fluorescent intensity per cell over time. (D) Manders overlap coefficient (M) representing the fraction of endosomes in which the Rab9 signal is colocalized with Cy5. (E) M representing the fraction of the ER in which the PDI signal is colocalized with Cy5. SNA H has a major advantage over SNA A and SNA E in the temporal release of antigen, by way of increased retention of peptide within the endosomes of BMDCs throughout the 24-h period. All analysis values are an average of 10–15 randomly selected images. Data presented as mean ± SEM (C–E). ***P < 0.001; **P < 0.01; *P < 0.05.

