Fig. 4.
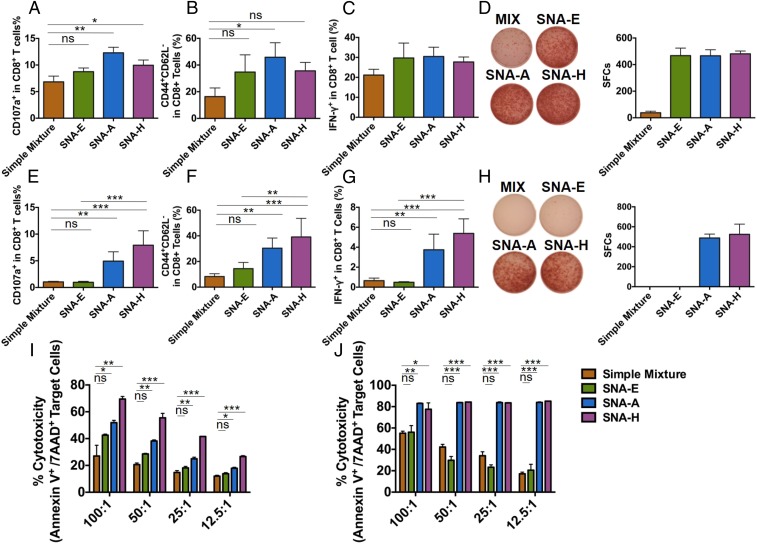
Antigen-specific CTL responses induced by SNA vaccination. C57BL/6 mice (n = 3) were immunized by three s.c. injections of SNAs or a mixture of OVA1 antigen (A–D and I) or E6 antigen (E–H and J) on days 0, 14, and 28. One week later, splenic T cells were analyzed by flow cytometry. Percentages of CD8+ T cells that were positive for CD107a (marker for cytotoxic activity) (A and E), for CD44+CD62L− (effector memory phenotype) (B and F), and for IFN-γ (C and G) are shown. The presence of IFN-γ–secreting splenic CD8+ T cells from immunized mice above was measured by ELISpot assay 48 h after restimulation ex vivo with OVA1 (D) or E6 antigen (H) [representative images (Left) and counts from three replicate measurements (Right)]. A comparison of OVA1-specific (I) or E6-specific (J) cytotoxicity induced by different SNAs is shown. Purified splenic CD8+ T cells from immunized mice above were cocultured with corresponding target tumor cells at the indicated ratios for 24 h, and tumor cell apoptosis was measured using annexin V and 7-aminoactinomycin D (7-AAD) staining by flow cytometry. Data are presented as mean ± SEM. ***P < 0.001; **P < 0.01; *P < 0.05. ns, not significant.

