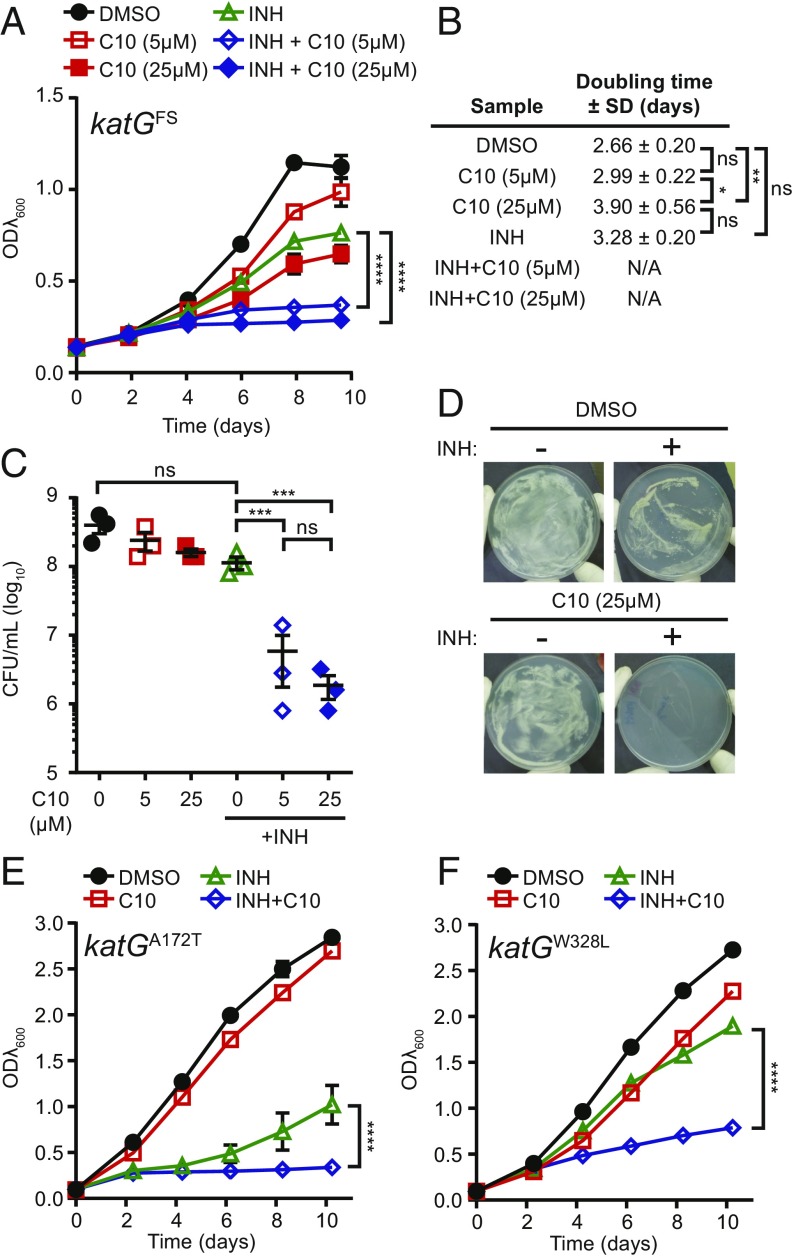
Fig. 3.
C10 resensitizes katG mutants to inhibition by INH. (A) katGFS Mtb was grown in Sauton’s medium with 5 μM or 25 μM C10 ± 0.25 μg/mL INH, and ODλ600 was measured over 10 d. Mean ± SEM is graphed. n = 3. (B) The doubling time of cultures in A was calculated between day 0 and day 4. This time frame was chosen to be consistent with that used in Fig. 2; however, the doubling time was similar when calculated over days 0–8. N/A indicates that growth was inhibited, and the calculation of doubling time did not accurately represent the data, as determined by R2 value (R2 <0.98). (C) After 10 d of treatment, cfu/mL were enumerated. Mean ± SEM values are graphed. n = 3. (D) katGFS Mtb was plated onto Sauton’s agar containing 0.5 μg/mL INH and/or 25 μM C10. Representative pictures from three independent experiments are shown. (E and F) Either katGA172T (E) or katGW328L (F) mutant Mtb was grown in Sauton’s medium with 5 μM C10 ± 0.25 μg/mL INH, and ODλ600 was measured over 10 d. n = 2. *P < 0.05; **P < 0.01; ***P < 0.001; ****P < 0.0001; ns, not significant by two-way ANOVA (A, E, and F) or one-way ANOVA (B and C) with Tukey’s test. Complete statistical comparisons for all data are provided in SI Appendix, Table S1.

