Fig. 1.
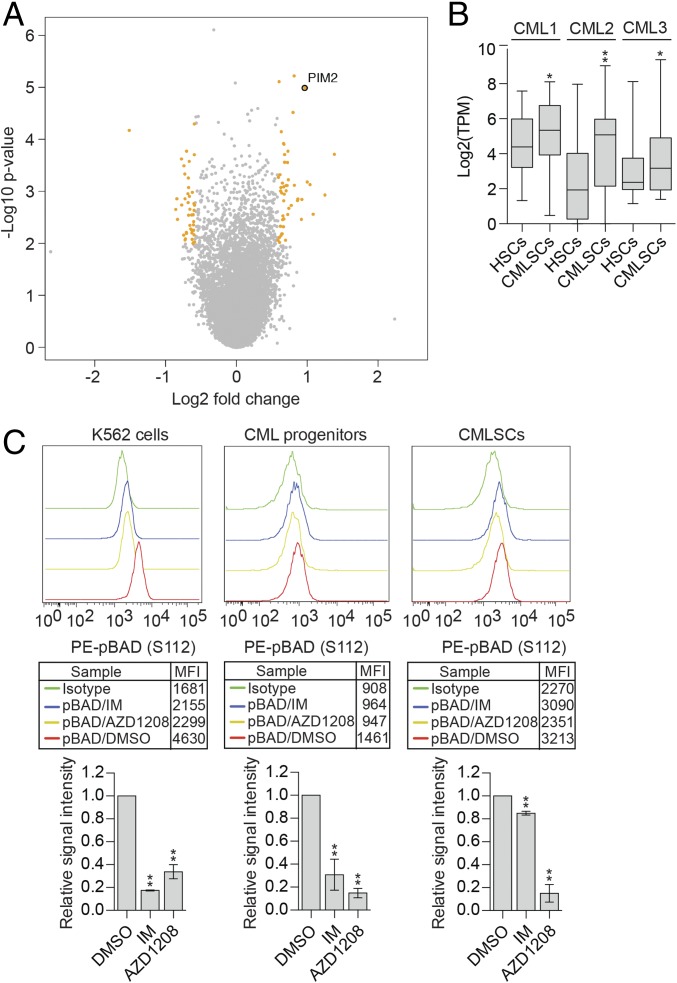
PIM2 is significantly up-regulated in CMLSCs relative to HSCs and promotes IM resistance by maintaining BAD phosphorylation. (A) Volcano plot showing the significance (y-axis, −log10 P value) and differential expression (x-axis, log2 fold change) for genes identified by the RNA-seq analysis. Genes with P < 0.01 and fold change >1.5 or <1/1.5 are highlighted in orange, and genes that are not significantly changed are indicated in gray. PIM2 is shown. (B) Boxplot showing the log2(TPM) value of PIM2 from intrapatient comparison in three CML samples. Boxed areas span the first to third quartiles, the center line represents the mean, and whiskers represent maximum or minimum observations. n = ∼48 biological replicates. (C) Phospho-flow analysis showing intracellular staining of pBAD (S112) levels in DMSO-, IM-, and AZD1208-treated K562 cells; CML progenitors (CD34+CD38+); and CMLSCs (CD34+CD38−CD90+). IgG was used for control staining. (Upper) Representative FACS histograms. The geometric mean fluorescence intensity (MFI) values are indicated in the boxed region. (Lower) Quantification of n = 3 or 4 biological replicates. Error bars indicate SEM. *P ≤ 0.05; **P ≤ 0.01.

