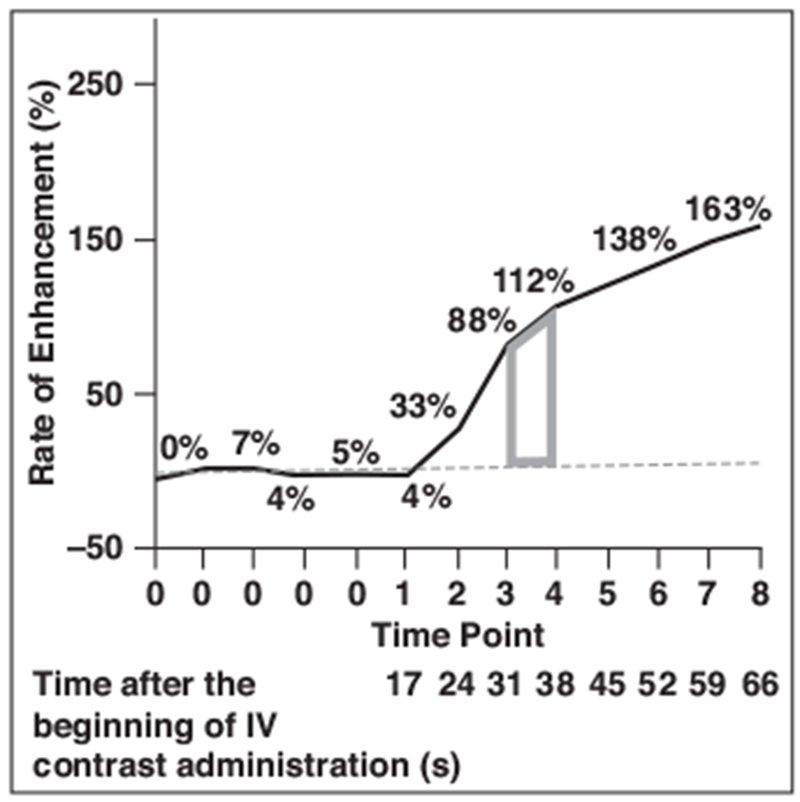
Fig. 3—

Graph shows kinetic AUC of time point x to time point x + 1 as trapezoid (gray), which represents AUC of time points 3 and 4. Kinetic AUC for multiple time points can be obtained by addition of each trapezoid from neighboring time points. Dashed line represents y = 0.
