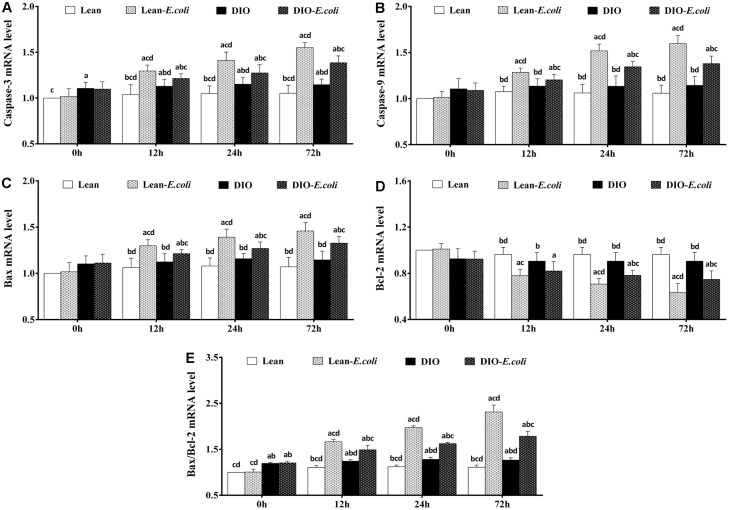
Figure 9.
The changes of mRNA expression levels in the liver (expressed as fold change relative to the lean group) after E. coli infection. (A) Caspase-3 ; (B) Caspase-9; (C) Bax; (D) Bcl-2; (E) Bax/Bcl-2. Note: Letter a, b, c or d represent difference (p<0.05) between the group and the lean group, lean-E. coli group, DIO group, or DIO-E. coli group, respectively.

