Figure 8.
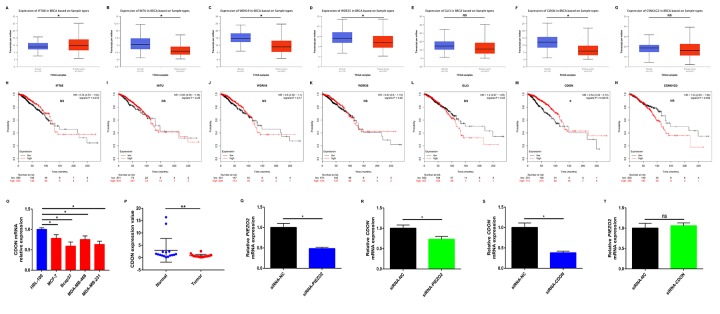
Identification of potential downstream of PIEZO2 in breast cancer. (A-G) Expression of IFT88, INTU, WDR19, WDR35, GLI3, CDON and CSNK1G3 in breast cancer analyzed using UALCAN; (H-N) prognostic roles of IFT88, INTU, WDR19, WDR35, GLI3, CDON and CSNK1G3 in breast cancer analyzed using Kaplan Meier-Plotter; (O) CDON expression in human breast cancer cell lines (MCF-7, Bcap37, MDA-MB-468 and MDA-MB-231) compared with that in normal breast cell line (HBL-100); (P) CDON expression in clinical breast cancer tissues compared with that in matched adjacent normal tissues (n=16); (Q) knockdown effect of siRNA-PIEZO2 in MCF-7 cell line; (R) expression change of CDON after silencing expression of PIEZO2 in MCF-7 cell line; (S) knockdown effect of siRNA-CDON in MCF-7 cell line; (T) expression change of PIEZO2 after silencing expression of CDON in MCF-7 cell line. *P<0.05; **P<0.01; “NS” represents no statistical significance.

