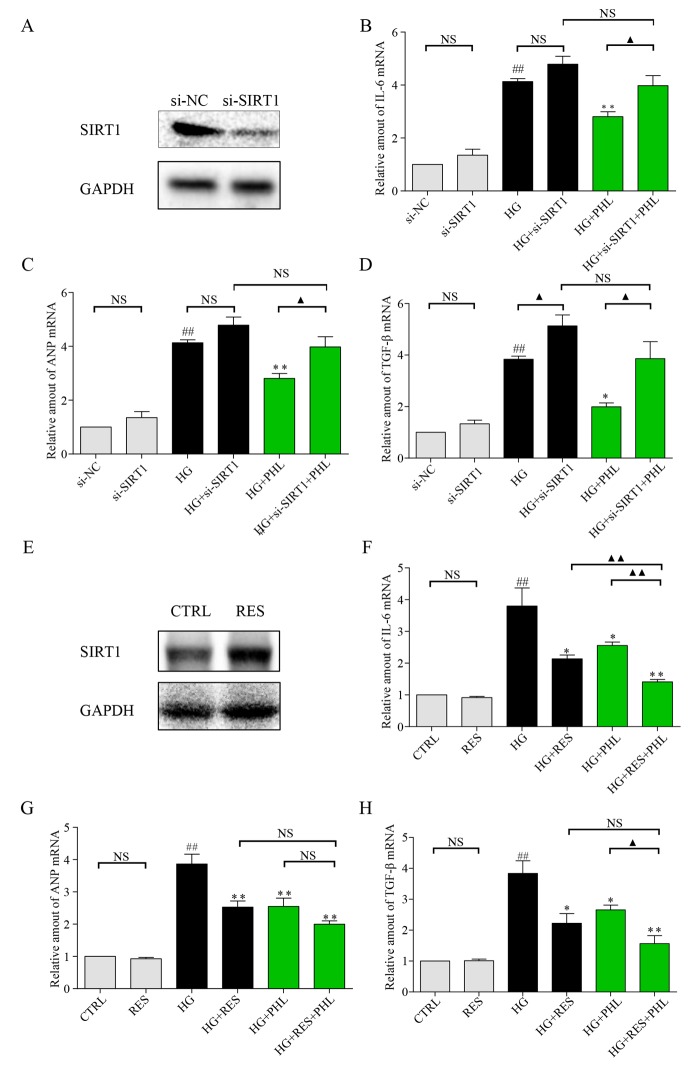
Figure 6.
Knockdown of SIRT1 aggravate HG induced inflammation, hypertrophy and fibrosis mRNA level in H9C2 cells. (A) Knockdown of SIRT1 expression by siRNA in H9C2 cells. Assessment of SIRT1 protein levels was performed 48 h following transfection. (B-D) Real-time qPCR assay showed the mRNA levels of IL-6 (B), ANP (C), and TGF-β (D) in negative control (NC) or SIRT1 siRNA transfected H9C2 cells treated with HG. H9C2 cells pre-treated with PHL (20 μM) for 1 h were stimulated by HG (33 mM). (E) Overexpression of SIRT1 expression by RES (50 μM) in H9C2 cells. Assessment of SIRT1 protein levels was performed 24 h after treatment for RES. (F-H) H9C2 cells pre-treated with RES, PHL or RES+PHL for 1 h were stimulated by HG (33 mM). Real-time qPCR assay showed the mRNA levels of IL-6 (F), ANP (G), and TGF-β (H). Data are presented as means ± SEM. *P < 0.05, **P < 0.01 v.s. HG group; ##P < 0.01 v.s. DMSO group; and ▲P < 0.05, ▲▲P < 0.01, ‘NS’ means no significant.

