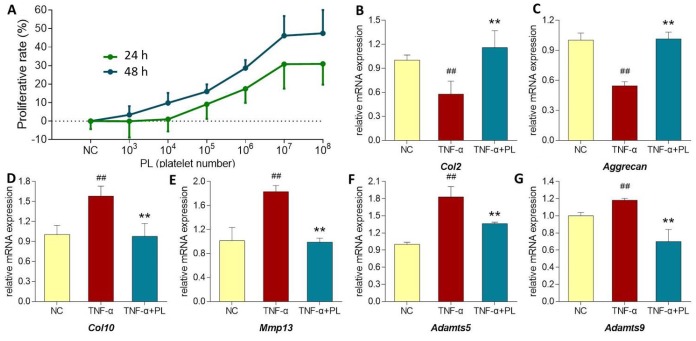
Figure 5.
(A) Chondrocyte viability at 24 h and 48 h after PL treatment. (B–G) Relative mRNA expressions of target genes in chondrocytes treated with only TNF-α or TNF-α plus PL. (B) Col2 expression; (C) Aggrecan expression; (D) Col10 expression; (E) Mmp13 expression; (F) Adamts5 expression; (G) Adamts9 expression. Values are shown as mean ± SD. ##P < 0.01 vs. normal cells; *P < 0.05 or **P<0.01 vs. TNF-α treated cells.

