
Figure 3:
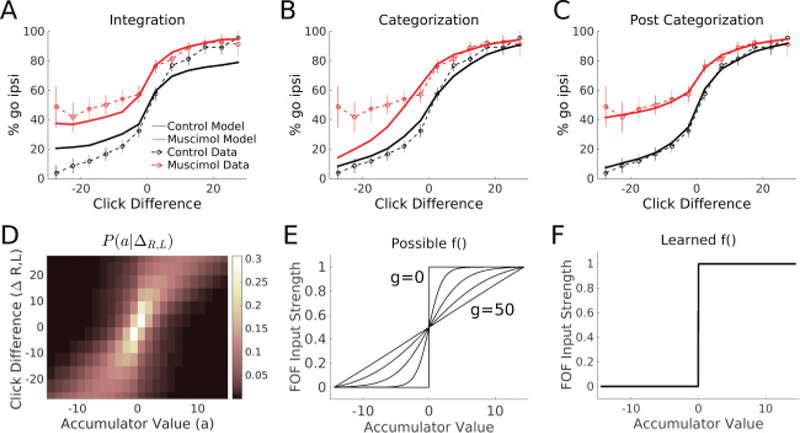
The integration model fails to fit the data; The postcategorization model fits the data well. (A-C) Solid lines indicate model behavior. Dashed lines indicate rat data. Data from left and right inactivations from all rats have been transformed into one “meta-rat” data set. Ipsilateral refers to the side of muscimol infusion relative to choice. Error bars on data indicate 95% confidence intervals. (A) The best-fit integration model on a test set. (B) The categorization model (setting g = 50) fails to match the bias on easy contralateral trials. (C) The best-fit postcategorization model (fitting g) on a test set matches both the control and perturbed psychometric curves. (D) A visualization of P(a|ΔR,L). For every click difference, the average distribution of accumulator values predicted by the accumulation model is shown as a heat map. (E) Possible thresholding functions. Changing g allows the threshold function f () to vary from linear to the Heaviside function. Five example values of g are plotted here: 0,2, 5,10, and 50. The minimum and maximum accumulation values used to bound the domain of f () were determined by the accumulation model and fit to data. (F) The learned threshold function f () for the memory model is a steep sigmoid function (g < 1). This indicates the input into the model is already categorical, and thus the FOF supports a postcategorization memory.