
Figure 4:
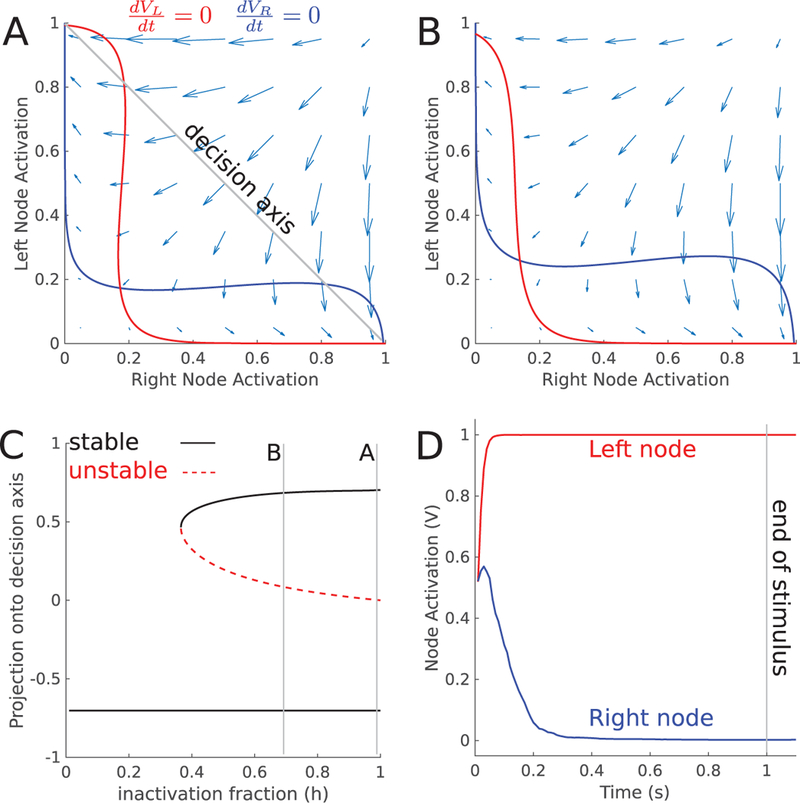
Dynamics of postcategorization model (A) Phase plane diagram for the postcategorization model during the memory period without inactivation. Solid lines are the nullclines of the external variables. (B) Same as panel A, but with partial muscimol inactivation of the left node. (C) Bifurcation diagram with respect to the inactivation fraction h. Near h = 0.35, the left attractor disappears in a saddle node bifurcation. Lines marked A and B show the parameter values used in panels A and B. (D) Mean activation of each node during a Go-Left trial (a = −10).