
Figure 5:
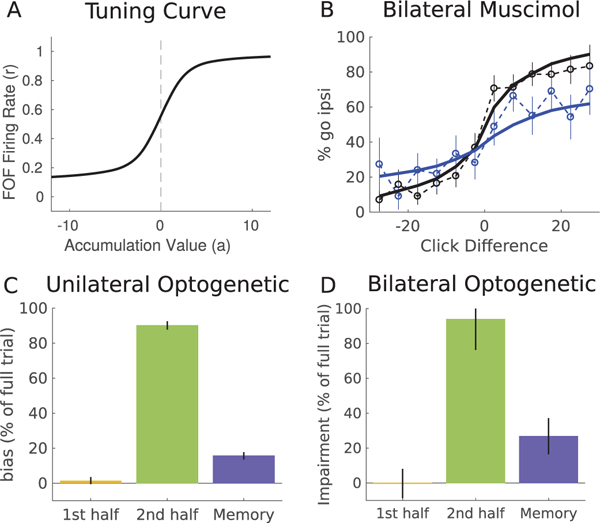
Properties of postcategorization model. (A) Tuning curve for FOF model showing the firing rate as a function of the accumulation value. Constructed using the method developed in Hanks et al. (2015). The slope of the tuning curve at a = 0 is 0.133, comparable to the FOF population average of 0.158 ± 0.015 reported in Hanks et al. (2015). (B) Psychometric curve for bilateral muscimol inactivations of the FOF. The model (solid line) is able to match the psychometric curves from the data (dashed). The model was fit simultaneously to both unilateral and bilateral data sets. (C, D) The postcategorization model was simulated using temporally precise inactivations, mimicking opto-genetic experiments. Error bars show model variability over repeated sampling of trajectories. Three trial epochs were inactivated: the first and second half of the evidence period (yellow, green) and the memory period (blue). All trials had a 1 s evidence period. Memory period duration was 100 msec. Inactivation effect is shown as the percentage of bias on model full trial inactivation. (C) Unilateral inactivation produces an ipsilateral bias. (D) Bilateral inactivation, showing average impairment on each side.