Figure 1.
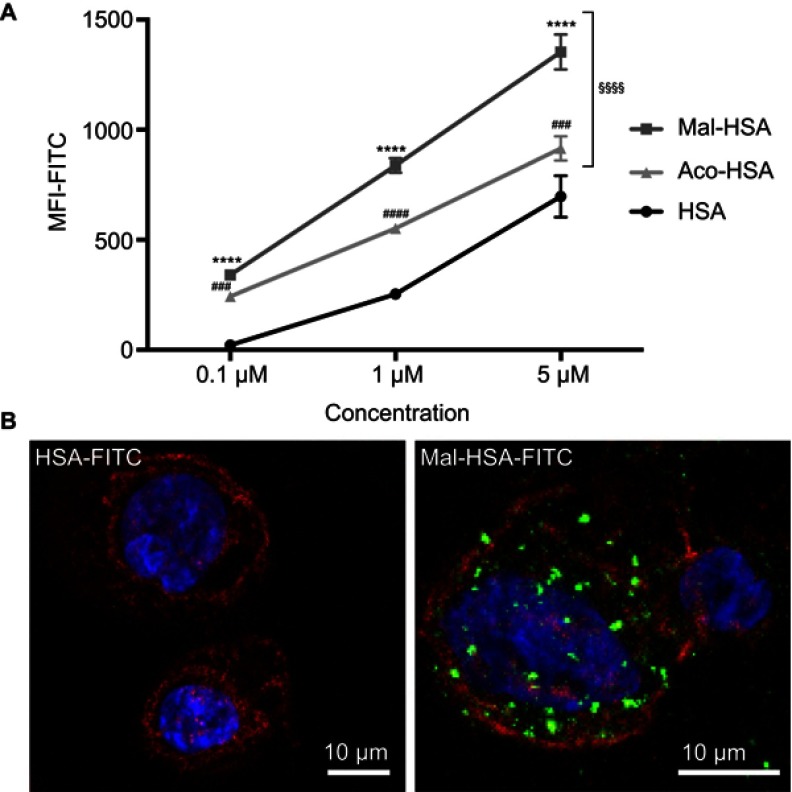
Evaluation of probe uptake in THP-1 macrophages.
Notes: (A) Flow cytometry analysis of uptake of three different concentrations (0.1 μM, 1 μM and 5 μM) of FITC-conjugated probes. Significantly higher uptake of Mal-HSA-FITC and Aco-HSA-FITC than of HSA-FITC by THP-1 macrophages was observed for all tested concentrations. Uptake of Mal-HSA showed significantly higher FITC MFI than that of Aco-HSA at all tested concentrations. The FITC MFI increased significantly with increasing concentrations of each probe P<0.0001. The results are pooled data from two independent experiments (triplicate wells). Data are presented as mean FITC MFI ± SD. ****P<0.0001 for Mal-HSA vs HSA; ###P<0.001, ####P<0.0001 for Aco-HSA vs HSA; §§§§P<0.0001 for Mal-HSA vs Aco-HSA (ordinary two-way ANOVA (factors: treatment and concentration) and Tukey’s multiple comparison test). (B) Confocal Z-stack maximum intensity projection images; left panel: (0.1 μM) HSA-FITC incubation, right panel (0.1 μM) Mal-HSA-FITC. Images show probes (FITC green), actin staining (phalloidin, TRITC red), cell nuclei staining (DAPI, blue).
Abbreviations: HSA, human serum albumin; MFI, median fluorescence intensity.

