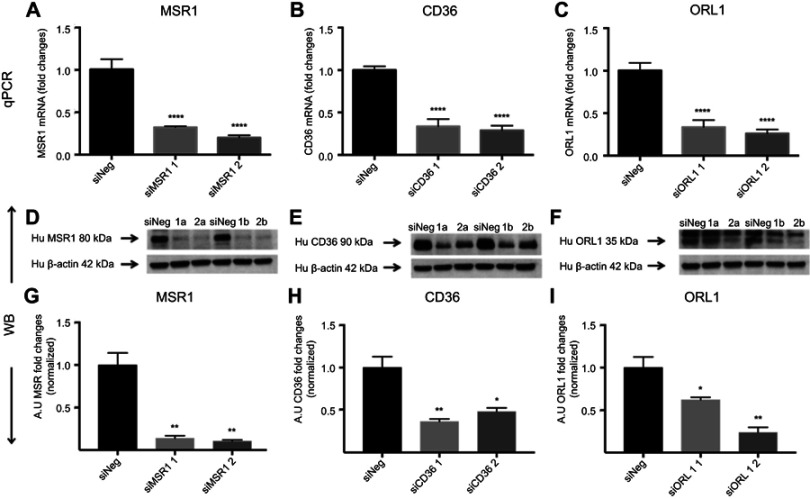
Figure S2.
Receptor silencing. (A–C) represent comparisons of qPCR data and fold changes in siRNA levels for MSR1, CD36 and ORL1 for two different silencers per gene. Data showed a 60–80% reduction compared with siNeg control. (D–F) show immunoblotting data for the same siRNAs. (G–I) Band intensities were measured in Fiji ImageJ.
Notes: Bar charts show the decrease in protein expression levels after silencing presented as arbitrary units (AU) and normalized for loading controls. The results are pooled data from two independent experiments (technical duplicates) with mean and SD. *P<0.05, **P<0.01, ****P≤0.0001 (ordinary one-way ANOVA and Dunnett’s multiple comparison test (siRNA compared with siNeg)).
Abbreviation: siNeg, siNegative.

