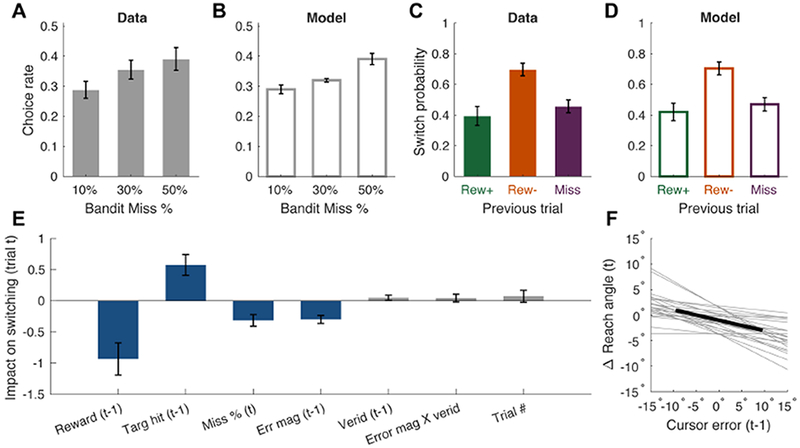
Figure 2: Behavioral and modeling results.

(A) Participants’ biases to select stimuli with different underlying chances of Miss trials. (B) Biases obtained from simulations of the fitted model. (C) Average switch probabilities separated by the outcome of the previous trial. (D) Switch probabilities from simulations of the fitted model. (E) Weights from the logistic regression on switch behavior, with blue bars reflecting statistically significant predictors. (F) Linear regression on change in reach angle as a function of signed cursor errors on the trial previous. This analysis is limited to trials in which the participant’s reach on trial t-1 was accurate, but the cursor was perturbed away from the stimulus (Miss trial). The dark line reflects the mean regression line, light grey lines are individual regression lines. Error bars = 1 s.e.m. See also Table S2 and Figures S1 and S2.
