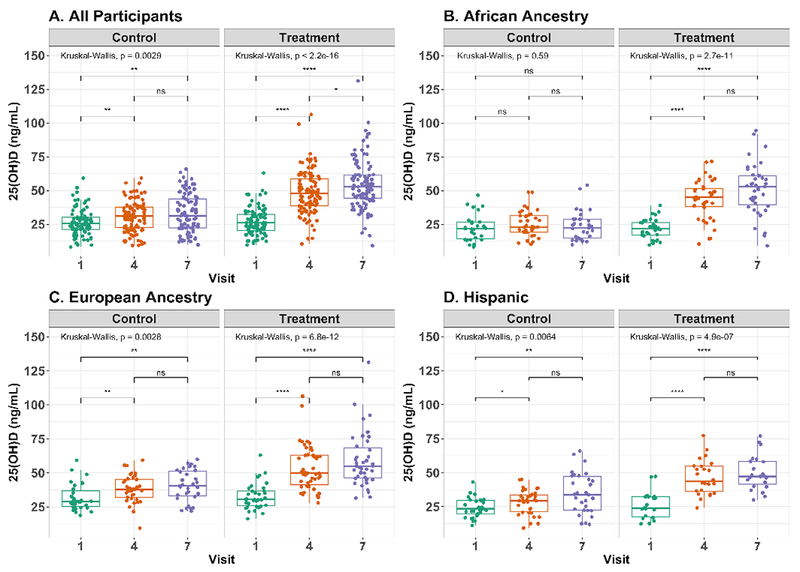
Figure 1. Total circulating 25(OH)D concentrations increase over pregnancy.

Boxplots of 25(OH)D concentration in plasma collected longitudinally over pregnancy. Whiskers extend to the highest/lowest value within 1.5 times the interquartile range and outliers beyond the whiskers are plotted as points. Significant differences in 25(OH)D between visits are indicated for A. all participants, B. women of African ancestry, C. women of European ancestry, and D. Hispanic women. Symbols indicating statistical significance - ns: p>0.05; *: p<=0.05; **: p<=0.01; ***: p<=0.001; ****: p<=0.0001. Figure was prepared using ggpubr61 R package.
