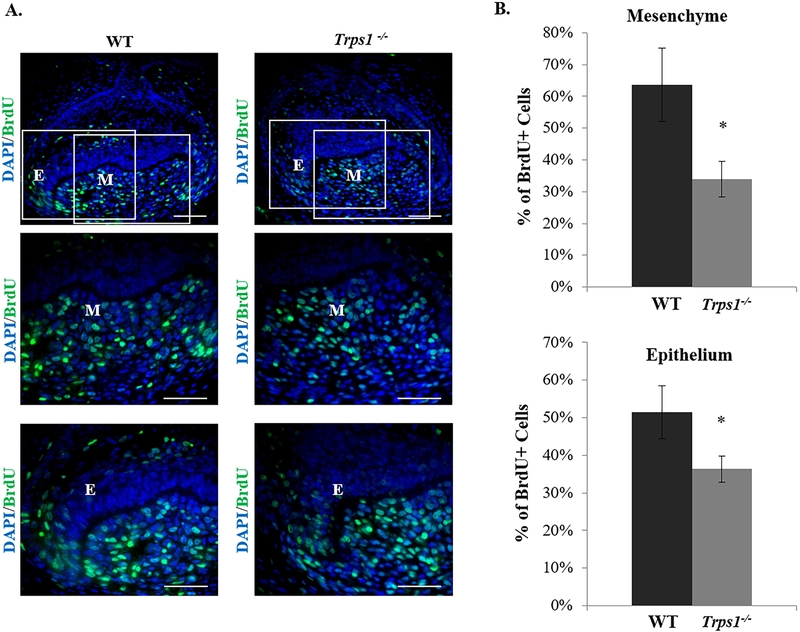
Figure 6. Analyses of cell proliferation in tooth organs of E16.5 WT and Trps1−/− mice.
(A) Representative images of IHC staining showing BrdU positive cells (green) in the first mandibular molar tooth organs of E16.5 mice. Boxed areas on the top panel images indicate areas within the dental epithelium (E) and dental mesenchyme (M), which are shown on the middle and bottom panels. Scale bar =50μm. (B) Graphs showing percentages of BrdU positive cells within the mesenchyme and epithelium of WT and Trps1−/− tooth organs. Data are presented as mean values ± SD (N=3 mice/genotype). *p≤0.05.

