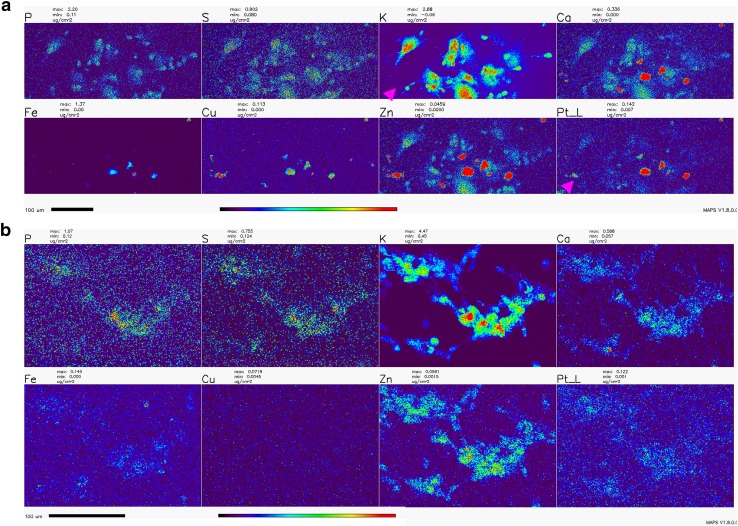
Fig. 6.
Overview XFM scans of NT2-N cells treated with cisplatin with and without the addition of WR1065. a—cisplatin only; b—cisplatin and WR1065 co-treatment. Note the heterogeneity between cells and that cells with low K signal intensities have highest Pt pixel intensities (magenta arrowheads). The same group of cells also had high Ca, Fe, Cu and Zn signals. In addition, cells with an apparently high Pt signal are relatively abundant in cisplatin alone treatment (a), compared to cisplatin-WR1065 combined treatment (b). Scale bars are 100 microns, color bar indicates that per pixel concentrations for each element range from black (no signal) to red (highest signal for a given element). Concentration ranges per-pixel are indicated above each element’s map, e.g., Pt per-pixel concentrations based in top panel (cisplatin alone) range from 0.007 µg/cm2 (dark blue pixels) to ≥ 0.142 µg/cm2 (red pixels); corresponding span of Pt per-pixel signal intensities in cisplatin-WR1065 panel (bottom) is 0.001 (dark blue pixels) to ≥ 0.122 µg/cm2 (for the few red pixels in this image). For mean per pixel elemental concentrations see Table 1

