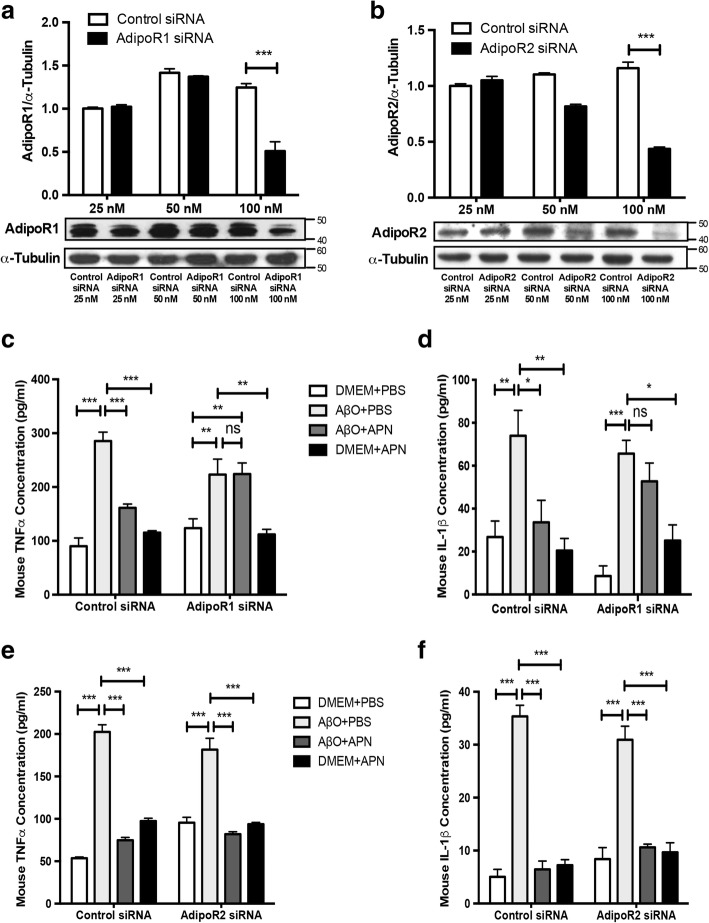
Fig. 4.
APN suppressed AβO-induced proinflammatory cytokine release in BV2 cells via AdipoR1. a, b Representative Western blot analysis of AdipoR1 and AdipoR2. BV2 cells were transfected with control siRNA, AdipoR1 siRNA, or AdipoR2 siRNA in a concentration-dependent manner (25, 50, 100 nM). c, d ELISA assays of TNFα and IL-1β were conducted after knockdown of AdipoR1. e, f ELISA assays of TNFα and IL-1β were conducted after knockdown of AdipoR2. Data were presented as the mean ± SEM for at least three independent experiments, and each performed in duplicates (n = 3). Two-way ANOVA with Tukey’s multiple comparison test revealed a difference between groups. *p < 0.05, **p < 0.01, ***p < 0.001; ns, statistically not significant

