Figure 2.
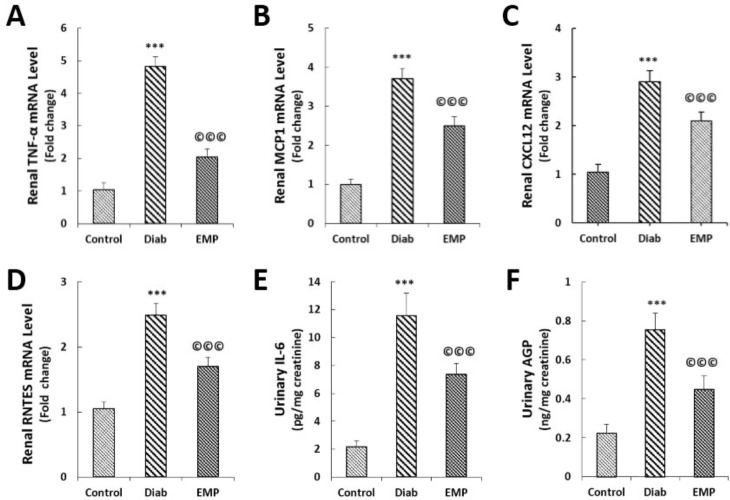
Effects of empagliflozin on renal gene expressions of TNF-α (A), MCP-1 (B), CXCL12 (C), RANTES (D), urine IL-6 levels (E), and urine AGP levels (F). A to D: Gene expressions were assessed by RT-qPCR. E and F: urinary levels of IL-6 were measured by the ECLIA method and AGP levels in urine were assayed by PETIA; data were normalized by urine creatinine levels as measured by Jaffe’s method. TNF-α, tumor necrosis factor alpha; MCP-1, monocyte chemoattractant protein 1; CXCL12, C-X-C Motif Chemokine Ligand 12; RANTES, regulated on Activation, Normal T Cell Expressed and Secreted; RT-qPCR, real-time quantitative polymerase chain reaction; ECLIA, electro-chemiluminescent immunoassay; AGP, alpha-1 acid glycoprotein; PETIA, particle enhanced turbidimetric immunoassay. Control, healthy control rats; Diab, diabetic control rats; EMP, diabetic rats treated with empagliflozin. A to E: ***P<0.01 vs Control group. A to E: ©©©P<0.01 vs Diab rats

