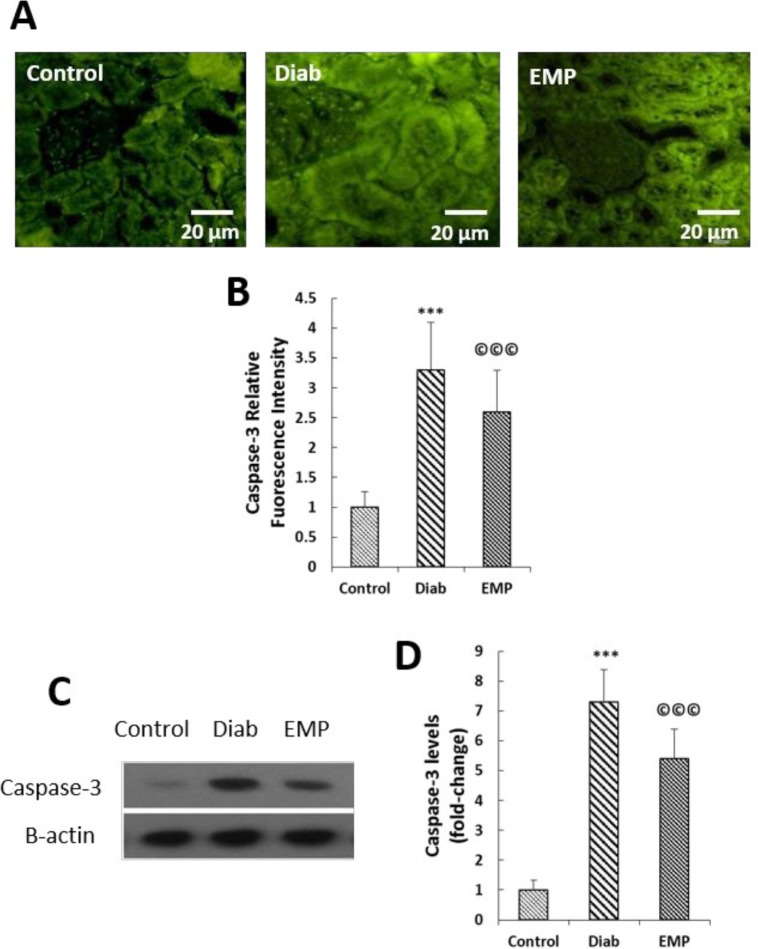
Figure 4.
Effects of empagliflozin on renal caspase-3 levels (A to B). A and B: as assessed by Immunofluorescence analysis; and obtained data were normalized by the values of the control group. C and D: as assayed by Western blotting; the values were first normalized by β-actin intensities and then were reported related to the values of the control group. Control, healthy control rats; Diab, diabetic control rats; EMP, diabetic rats treated with empagliflozin. ***P<0.01 vs Control group. ©©©P<0.01 vs Diab rats

