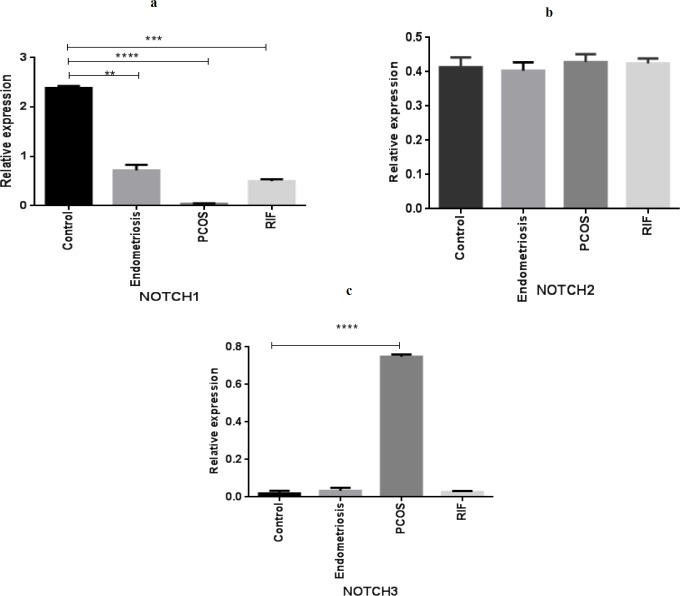
Figure 1.
Gene expression pattern of NOTCH receptors (NOTCH1, NOTCH2, NOTCH3) in women with polycystic ovary syndrome(PCOS), endometriosis, and repeated implantation failure(RIF) groups compared with the control group (mean± SEM)
** represents significance at P<0.01, *** represents significance at P<0.001
****represents significance at P<0.0001

