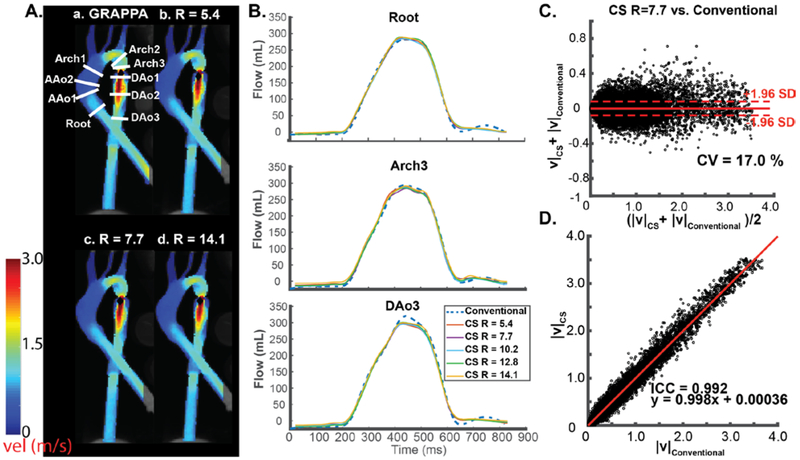
Figure 2:
In-vitro aorta flow phantom analysis. (A) Systolic velocity maximum intensity projections (MIPs) of conventional 4D flow (a) compared to CS accelerated 4D flow MRI with three representative acceleration factors (b-d). a, location of 9 2D analysis planes for quantification of peak velocities and flow-time curves. (B) Representative flow curves at three locations in the aorta for conventional 4D flow (dashed blue line, GRAPPA, R=2) compared to CS accelerated 4D flow with 5 different acceleration factors ranging from R=5.4-14.1. (C) Voxel-by-voxel Bland Altman comparison of absolute velocities in the entire aorta phantom between CS accelerated 4D flow with R=7.7 vs. conventional 4D flow. (D) Voxel-by-voxel orthogonal regression analysis between CS accelerated 4D flow with R=7.7 vs. conventional 4D flow.

