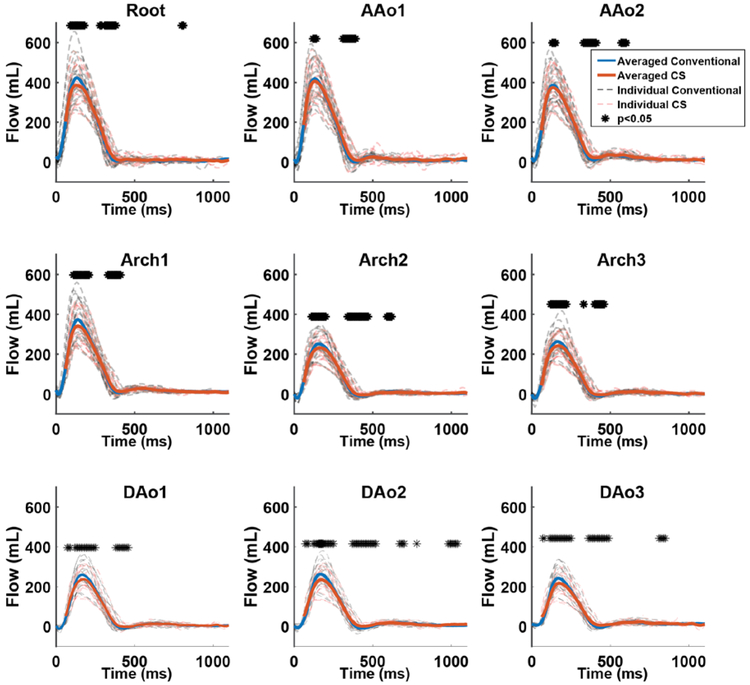
Figure 4:
Flow-time curves of all 20 healthy volunteers for all 9 2D analysis planes. Solid orange and blue lines represent flow curves averaged over all n=20 subjects for CS and conventional 4D flow, respectively. Dotted black and red lines represent flow curves for each individual volunteer (n=20). (*) above the curves represent time points with significant differences (p<0.05) between the conventional and CS accultured 4D flow acquisitions. Good agreement between conventional and CS 4D flow derived flow-time curves as well as mild peak flow underestimation by CS accelerated 4D flow can clearly be appreciated. Most pronounced differences were found at areas of peak flow or transitions to diastole.

