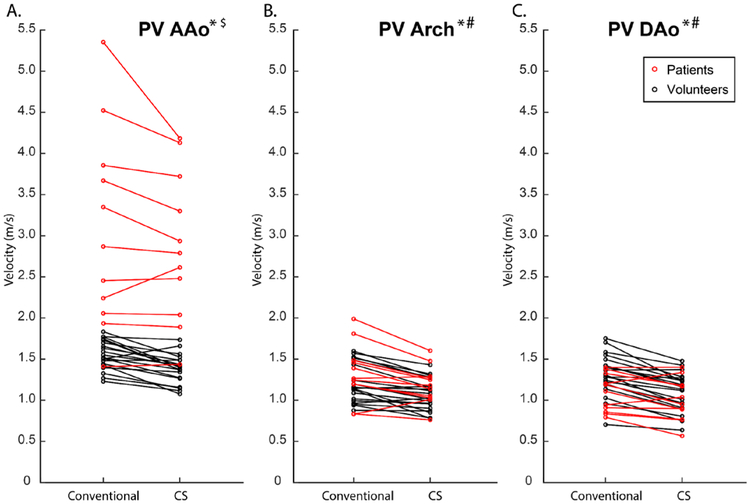
Figure 5:
Peak Velocities for conventional and CS 4D flow over all patients and volunteers in the ascending aorta (AAo), arch, and descending aorta (DAo). Graphs demonstrate a tendency to underestimate velocities in the CS 4D flow in all three regions of interest. Most patients (red circles) had some form of aortic stenosis due to their various aortic valve pathologies, and thus their peak velocities were higher than those of the volunteers in the AAo.
*significant differences between CS and conventional in volunteers
# significant differences between CS and conventional in patients
$ significant differences between volunteers and patients

