
Figure 2. Assay stability against additives or time.
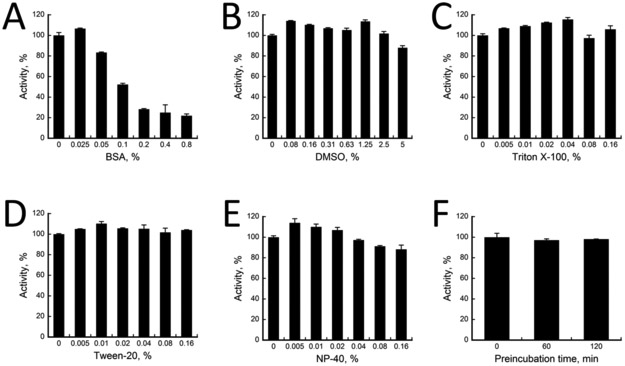
Activity of LH2 (in %) were measured against variations of A) BSA, B) DMSO, C) triton X-100, D) tween-20, E) NP-40, and F) incubation time. In all cases, a positive control with 0% variation is normalized to 100 % activity. % activity of LH2 assays containing variations were calculated according to [], where x0 is RLU for positive control and xi is RLU for varying samples.