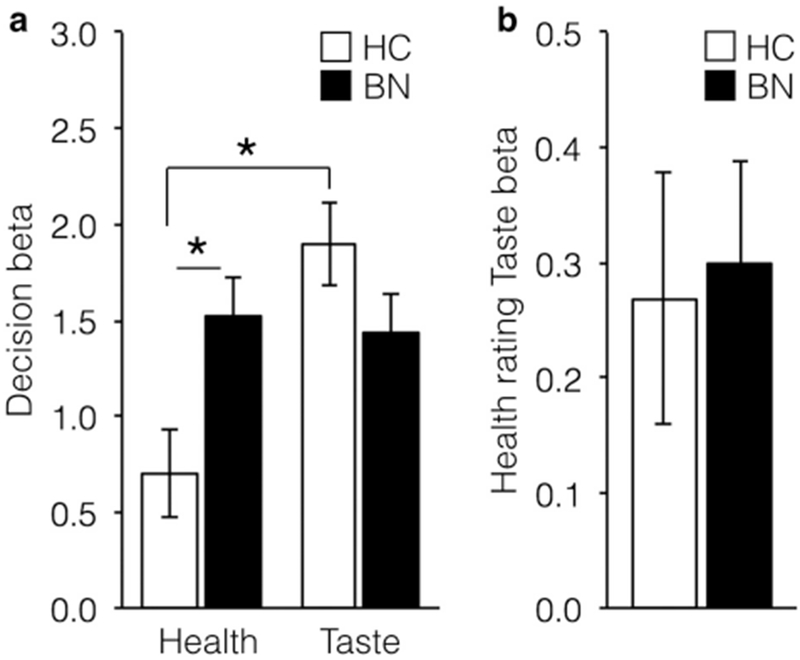
Figure 4. Relationships between health ratings, taste ratings, and food choice.

(a) Health ratings influenced food choice significantly more in the BN group relative to HC group (χ2=0.001, p=0.97). Among HC, taste ratings influenced choice more than did health ratings (χ2=22.86, p< 0.00001). (b) Health ratings were significantly related to Taste ratings in BN and HC groups (χ2= 16.64, p<0.0001). * indicates p<0.05, HC = healthy controls, BN = bulimia nervosa.
