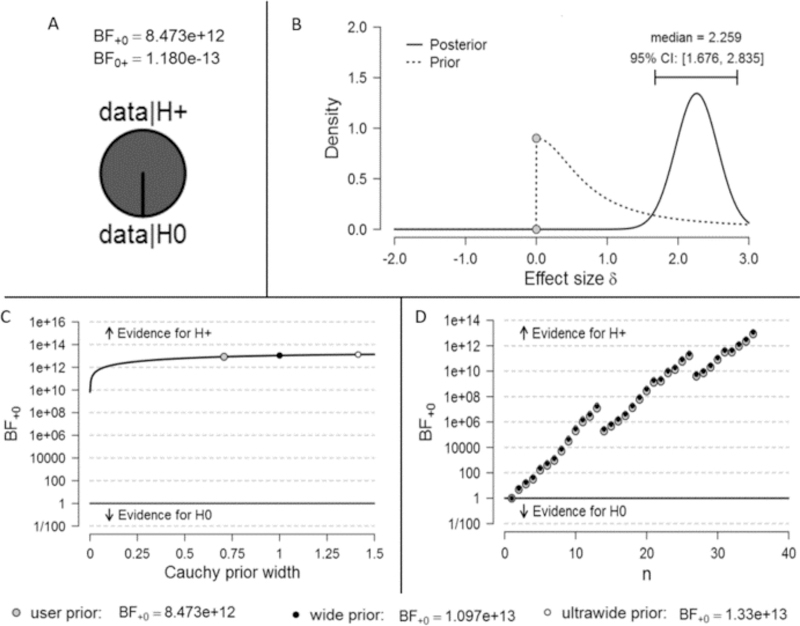
Fig. 5.
Inferential plots for Study 3, based on Bayesian one-sample t-tests on overall performance of U.S. participants. a. Pizza plot providing a proportional representation of the ratio of evidence for the alternative (context) hypothesis to evidence for null (universal) hypothesis. b. Posterior distribution based on a one-sided prior distribution. Posterior mass to the right of zero indicates that participant performance is consistently above chance-level responding of .5. c. Bayes factor robustness check. Narrower priors indicate a smaller range of expected effect sizes, favoring the null (universal) hypothesis. d. Sequential analysis of evidence accumulated over the course of data collection. All figures adjusted from JASP (JASP Team, 2017).

