
FIGURE 3.
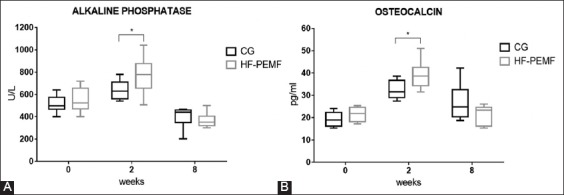
Serum concentration of ALP (A) and OC (B) in control and HF-PEMF group, at the beginning of the experiment (before surgery), and at two and eight weeks after surgery. During the first two weeks postoperatively, the serum concentration of ALP and OC increased in both groups. At two weeks, the concentration of ALP and OC was significantly higher in HF-PEMF compared to control group (for ALP p = 0.026; for OC p = 0.006). From the second to eighth week, the concentration of ALP and OC decreased in both groups. At eight weeks, there were no significant differences between two groups in the concentration of ALP (p = 0.056) and OC (p = 0.19). *indicates statistically significant difference. CG: Control group; HF-PEMF: High-frequency pulsed electromagnetic field; ALP: Alkaline phosphatase; OC: Osteocalcin.