
FIGURE 4.
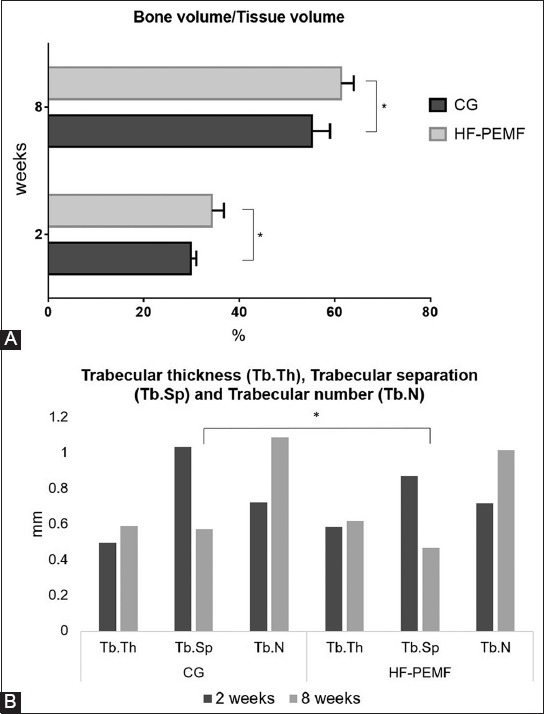
Micro-CT analysis of TV, BV, BV/TV ratio, and trabecular bone architecture in the ROI within callus, in control and HF-PEMF group at two and eight weeks after surgery. A) At two weeks postoperatively, the TV and BV were significantly larger (p = 0.038 and p = 0.041, respectively) and the BV/TV ratio was significantly higher (p = 0.047) in HF-PEMF compared to control group. At eight weeks postoperatively, the TV was significantly larger in control compared to HF-PEMF group (p = 0.006), but no significant difference in the BV was observed between two groups (p = 0.1). The BV/TV ratio was significantly higher in HF-PEMF vs. control group (p = 0.01). B) At two weeks postoperatively, there were no statistical differences between two groups in the Tb.Th (p = 0.21), Tb.Sp (p = 0.18) and Tb.N (p = 0.13). At eight weeks postoperatively, there was a significant difference between two groups in the Tb.Sp (p = 0.018) but not in the Tb.Th (p = 0.41) and Tb.N (p = 0.1). *indicates statistically significant difference. Micro-CT: Micro-computed tomography; ROI: Region of interest; TV: Total tissue volume; BV: Total bone volume; BV/TV: Bone volume relative to total tissue volume; Tb.Th: Trabecular thickness; Tb.Sp: Trabecular separation; Tb.N: Trabecular number; HF-PEMF: High-frequency pulsed electromagnetic field; CG: Control group.