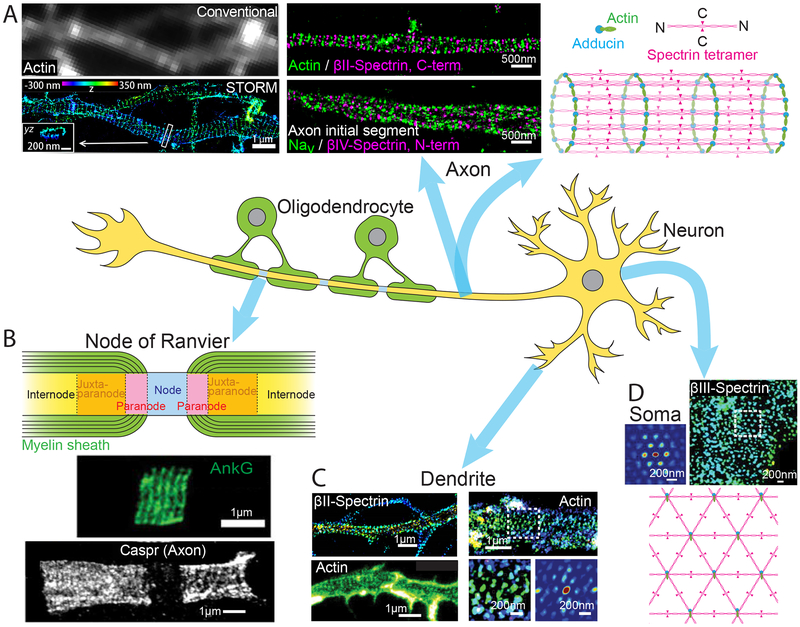
Fig. 2. The membrane-associated periodic skeleton (MPS) in neurons discovered by super-resolution imaging.
(A) Quasi one-dimensional (1D) periodic MPS observed in axons using STORM. Left: Comparison of diffraction-limited (top) and 3D-STORM (bottom) images of actin in axons. STORM image shows the periodic distribution of actin rings along the axon that is obscured by diffraction-limited imaging. Scale bar, 1 μm. Middle: Two color STORM images showing the periodic distributions of and spatial relationship between actin, spectrins (βII- and βIV-spectrin), and voltage gated sodium channels (Nav). Scale bar, 500 nm. Right: Schematic of the 1D MPS structure showing the organization of actin, spectrin tetramers, and adducin. Modified with permission from Ref. (47). (B) Top: Schematic of a node of Ranvier. Center: STED image showing the periodic distribution ankyrin-G (AnkG) on the 1D MPS structure at a node of Ranvier. Modified with permission from Ref. (74). Bottom: STED image showing the periodic distribution of the adhesion molecule Caspr on the 1D MPS structure observed flanking a node of Ranvier. Modified with permission from Ref. (76). Scale bars, 1 μm. (C) MPS structures observed in dendrites: Top-left: 1D MPS in a dendritic region observed by STORM imaging of βII-spectrin. Modified with permission from (72). Bottom-left: 1D MPS observed in a dendritic region by STED imaging of Actin. Modified with permission from Ref. (73). Right (top): 2D polygonal lattice-like arrangement of MPS components observed in a dendritic region by STORM imaging of actin. Right (bottom): A magnified region of the STORM image (left) and the corresponding 2D autocorrelation analysis (right) are shown. Modified with permission from Ref. (77). Scale bars, 1 μm. (D) 2D MPS observed on the soma of neuron by STORM imaging of βIII-spectrin (top-right) along with a 2D autocorrelation analysis of the boxed region (top-left). Bottom: Schematic of the 2D MPS structure. Scale bars, 200 nm. Modified with permission from Ref. (77).

